

Rising Sea Levels
A rise in sea levels is one of the best-known consequences of global warming. We'll take a look at two ways that higher temperatures worldwide are producing higher sea levels. We'll also debunk one misconception about another result of global warming that does not directly cause higher sea levels. Finally, we'll place the current situation into the context of rising (and receding) sea levels over the past few million years.
Melting Ice Sheets and Glaciers
 As
was mentioned in the reading on the water cycle, about 97% of Earth's water
is in the oceans already. About 2/3rds of the remainder is in ice sheets and
glaciers. Various estimates place the total volume of ice in glaciers and ice
sheets at somewhere between 24 and 30 million cubic km. About 90% of the polar
ice sheet and glacial ice is in Antarctica; most of the rest is in Greenland;
a tiny fraction is locked up in mountain glaciers elsewhere.
As
was mentioned in the reading on the water cycle, about 97% of Earth's water
is in the oceans already. About 2/3rds of the remainder is in ice sheets and
glaciers. Various estimates place the total volume of ice in glaciers and ice
sheets at somewhere between 24 and 30 million cubic km. About 90% of the polar
ice sheet and glacial ice is in Antarctica; most of the rest is in Greenland;
a tiny fraction is locked up in mountain glaciers elsewhere.
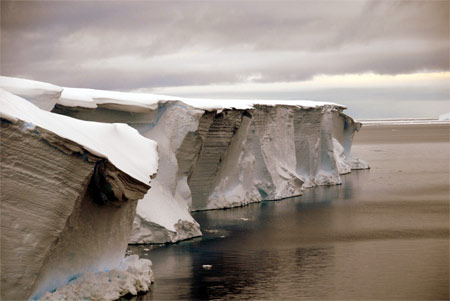
As global temperatures have risen, some of this ice has begun to melt. Of course, each year, with the changing seasons, new snowfall adds mass to the ice while warmer summer temperatures cause some melting and thus a reduction in the ice mass. Overall, however, global warming has begun to disturb this equilibrium; melting has outpaced snowfall, and the net amount of ice has begun to diminish. So far, this net loss of ice has been greatest in the mountain glaciers outside of the polar regions and in the Greenland ice sheet, while the Antarctic ice sheet seems (so far) less disturbed. As this ice melts, the runoff flows down to the sea, gradually raising sea levels.
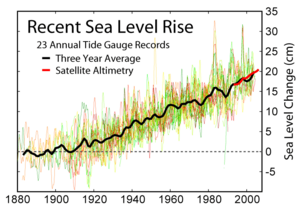
How gradually? Scientists use averages from a large number of tide gages around the globe to estimate global average sea level. Since 1900, sea level has risen between 1 and 2 millimeters per year (10-20 cm or 3.9-7.9 inches per century) on average. During the preceding 3,000 years, scientists estimate that sea level was almost constant, rising at a rate of 0.1 to 0.2 mm per year.
Several factors complicate such measurements. Tides, storm surges and other "peaks and valleys" in ocean level caused by atmospheric pressure systems, and similar phenomena cause local variations in sea level. Each year, sea level rhythmically rises and falls by about 8 mm as snowfall seasonally accumulates on the ice sheets and melts away again in summer. The sizes of ocean basins change, ever so slightly, plate tectonics drags continents around the face of the globe and creates new islands via volcanism. Land masses that were depressed in elevation by the weight of massive ice caps during the last ice age continue to "spring back" to their former positions, thousands of years after the weight of the ice caps was removed (rocks "spring back" rather slowly!).
Since 1992, satellite measurement of sea levels have supplemented the tide gage readings. Unfortunately, the satellite altimetry readings do not match the tide gage values; the satellite indicates a rate of sea level rise of 3 mm per year, while no such rate increase appears in the tide gage records for the same time period. Scientists are not yet certain what to make of the discrepancy. Some think the satellite is incorrectly calibrated. Others suspect that the difference may somehow be related to the different range of coverage of the two systems; the satellite provides readings covering much of the globe, while tide gages are necessarily relegated to coastlines.
What about the future? Given the difficulties associated with accurately measuring current sea level rise, it probably comes as no surprise that estimating future sea level rise is a tricky business. The IPCC's Third Assessment Report in 2001 predicted sea level would rise 9 to 88 cm by 2100. Recent field work seems to indicate that glaciers in Greenland may be melting much more quickly that previously thought, fueling speculation that sea level might rise more quickly than once presumed. This is, of course, an area of ongoing active research.
|
Images courtesy the National Snow and Ice Data Center (NSIDC). Animation by Windows to the Universe staff (Randy Russell). |
Melting Sea Ice - A Misconception
Note that so far we have been talking about ice masses located on land. As land ice melts and the meltwater runs down to the sea, it obviously adds water to the oceans and raises sea levels. What about sea ice, the stuff that forms a frozen cap floating on top of water?
Decreases in sea ice, especially in the Arctic, have also been grabbing headlines of late. You've probably read stories about the plight of polar bears, who rely on the presence of sea ice for their seal-hunting livelihoods. Scientists have indeed noted a fairly rapid decline in the overall size of the area covered by sea ice in the Arctic. This decline does have implications for climate change; it decreases albedo (high albedo ice-covered areas become low albedo ocean), causing those areas to absorb more solar radiation, causing further heating. Also, changes to ocean salinity (the sea ice has little salt in it, so it releases virtually fresh water as it melts) and temperature caused by sea ice melting alter ocean currents, which also affects climate. But how does melting sea ice affect sea level?
In short, it doesn't. When floating ice melts, it doesn't change the level of the water it was floating in. As you are probably aware, ice is less dense that liquid water; that's why ice floats. When ice melts, it becomes denser; the same mass fits into a smaller volume. The change in volume exactly offsets the extra bit of the ice that was sticking up above the water's surface. Don't believe me? Try this: place some ice in a cup of water, and make a mark at the waterline. Wait for the ice to melt. Check the new water level. It won't change!
So, although melting sea ice is both an indicator of and a contributor to climate change, it does not alter sea level. Melting ice on land, however, does... when the meltwater flows into the sea.
Thermal Expansion of Sea Water
You probably realize that most materials expand when heated. Water is one such material, at least over most temperature ranges. You may not realize, however, that this tendency of water to expand when heated plays a role in sea level rise.
|
Water
temperature |
% volume increase
per each 1° C temperature increase |
|
10° C
|
0.0088%
|
|
20° C
|
0.021%
|
|
50° C
|
0.046%
|
As was mentioned earlier, rising atmospheric temperatures will gradually produce elevated temperatures in the oceans as well. This temperature rise is likely to be quite small at first; however, the volume of water affected is immense. The table (left) shows the percent volume increase for a quantity of water for each 1° C of increased temperature, at various initial temperatures.
Here's an example. Suppose 1 liter of water, initially at 20° C, was heated to 21° C. It would expand by 0.021%. It would increase in volume by 0.21 milliliters. This tiny increase seems trivial, until we recall that the world's oceans contain some 1,400,000,000 cubic kilometers of water! Even a tiny fractional increase adds up to a very large actual increase in volume, and hence substantial sea level rise.
Of course, the different layers of the ocean (surface layers and deep ocean) will not be heated equally. Also, the volumes of the different layers are not the same; nor are their initial temperatures, which affects the rate at which they expand (see table). The surface layer of the ocean contains roughly 50,000,000 km3 of water, and has temperatures ranging from freezing near the poles to around 30° C in the tropics. The mid ocean, where the thermocline produces the transition from warm surface to cold deep water, holds about 460,000,000 km3 of water and spans a large range of temperatures. The deep ocean holds the most water, some 890,000,000 km3, but because of its relatively cool temperatures of 4° C or less is also less prone to expansion as its temperature rises slightly. Once again, the story is complex and scientists do not yet have all the answers. It is easy to understand why supercomputers are so widely used in climate research! Suffice it to say that computer models of climate change predict that thermal expansion of sea water will play as large a role, or possibly greater, than meltwater runoff in raising sea levels in the coming decades and centuries.
|
Sea level data from 1880 to the present, as measured by tide gages and
satellite altimetry. The numerous colored lines indicate records from
each of the 23 tide gages; the thicker black curve is a running 3-year
average of all gages combined. The shorter thick red line shows recent
data from satellite measurements. |
|
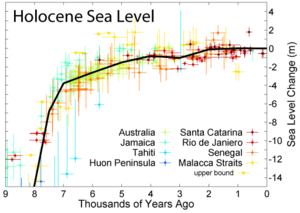
A compilation of sea level estimates for most of the Holocene interglacial,
from 9,000 years ago to the present day. The thick black line is a least-squares
fit to the data points. Sea level changes within the last century are
not resolved in these data sets. |
|
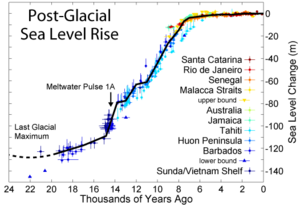
Sea level data from 24,000 years ago to the present. This data set spans
the time from the last glacial maximum during the Wisconsin glacial 20,000
years ago to today. The thick black curve is a least squares fit of the
various data sets, and shows that sea level has risen more than 120 meters
since the last glacial maximum. |
|
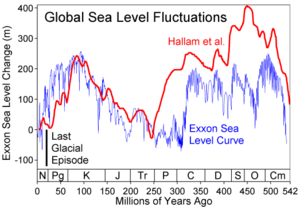
Estimates of sea level over the last 540 million years. The two curves
(red and blue) represent radically different techniques for estimating
sea level. Neither has sufficient resolution to actually show sea level
changes during the most recent few millennia. The vertical black bar in
the lower left corner indicates the range of sea level values during the
most recent glacial to interglacial transition (from the Wisconsin glacial
through the Holocene interglacial). |
History of Rising (and Falling!) Sea Levels
Humans did not invent climate change. Earth's climate has been changing throughout our planet's history. Cool periods, including ice ages, have created vast continental ice sheets at times, dramatically lowering sea levels worldwide. Warmer spells melted those ice sheets (and at times, the entire polar caps), raising sea levels and flooding what are now coastal land areas. Such events have happened many times, even in the fairly recent few million years of Earth's 4.6 billion year long "lifetime". A thorough account of these events is beyond the scope of this course. We will, however, take a quick look at a few of the more recent freeze/thaw cycles and their effects on sea levels, to help provide us with perspective on modern times and our current episode of climate change.
Let's quickly review some terminology related to "ice ages" and look at some of the most recent ones. Scientists and the general public actually use the term "ice age" in a slightly different way, though both use it to refer to an especially cold period in Earth's history when ice sheets covered much of the land for long periods. From the stricter scientific perspective, an "ice age" is a period in Earth's history when temperatures were cool enough to form ice caps at the poles. This implies, of course, that during part's of our planet's history the poles have been ice free; and such is indeed the case. By this definition, we are currently in an ice age; one that began about 40 million years ago (mya) and intensified around 3 mya. Scientists recognize, however, that there are warmer and cooler "spells" during an ice age. They call the cold spells "glacials" and the warmer periods in between "interglacials". Colloquial use of the term "ice age" corresponds to the scientific term "glacial".
We are now in the midst of an interglacial, called the Holocene, that began somewhere between 10,000 and 12,000 years ago. The last glacial (or colloquially, "ice age") that ended roughly 10 millennia ago is referred to as the Wisconsin glacial in North America (it goes by different names in Europe!). The Wisconsin glacial began around 110,000 years ago, while the prior interglacial lasted about 20,000 years starting 130,000 years ago. Certain periodic changes in Earth's orbital motions, referred to as a group as Milankovitch Cycles, tend to usher glacial and interglacial periods in and out during the course of an ice age. These cycles have periods of 40,000 and 100,000 years. Scientists believe, based on the Milankovitch Cycles, that the current interglacial is likely to end roughly 50,000 years from now, barring excessive human disruption of natural patterns of climate change.
During the peak of the Wisconsin glacial glaciers covered almost a third of Earth's land surface, as compared to about 11% today. At the time of the last glacial maximum, about 20,000 years ago, sea levels were about 122 meters (400 feet) lower than they are today. As global temperatures began to rise and the ice began to recede, sea levels rose relatively rapidly at an average rate of about 10 mm/year (a meter per century) between 15,000 and 6,000 years ago. This rate of sea level rise is about 5 to 10 times as rapid as the rise we are currently experiencing. A vertical rise of sea level by a meter per century may not seem an especially radical change. However, recall that coastal plains and continental shelves have shallow slopes; so a vertical rise of one meter corresponds to a change in location of the coastline of roughly a kilometer in many places.
Before the Wisconsin glacial, during the preceding interglacial, a warmer climate melted much of the ice from the preceding glacial. Around 125,000 years ago sea levels were about 5.5 meters (18 feet) higher than they are today.
As was mentioned earlier, the current ice age (in the stricter scientific sense of the term) began about 40 million years ago and intensified three million years ago. Before the beginning of this more intense period, scientists believe that sea levels may have been as much as 50.3 meters (165 feet) higher than today during interglacial spells.
If your are especially interested in the history of sea level changes and want an activity for your students related to this topic, follow this link to our "Mapping Ancient Coastlines" activity page.