
Case Study: Looking to the Past to Understand Natural Climatic Forcings with NCAR Scientist Caspar Ammann
Why Is it Important to Understand Natural Forcings Like Volcanic Eruptions?
In global climate model outputs for the 20th century, we see that a combination of anthropogenic and natural forcings most accurately describe the condition of the Earth's climate system. Natural forcings, including volcanic eruptions and solar fluctuations, can not account for recent warming during the 20th century. Those who argue that humans are not responsible for recent global warming often cite that natural forcings must be the cause. And if models do not agree, then we just don't understand the natural forcings well enough. If we did, they argue, then we would find that they are responsible for all warming.
A global climate model will only be a good predictor of climate through time if the forcings are accurately represented. Testing whether a model is able to accurately depict climate events given a set of forcings is essential. To test our understanding of natural forcings on the climate system, we can look to the past, to a time before the industrial revolution, when there was little anthropogenic influence, to see if natural forcings can be used to explain all climate variability. If our understanding of natural forcings is able to explain variations of past climates, then we have a good understanding of how the climate system would work without human influence. A better understanding of natural forcings will help us understand the accuracy of models predicting future climate.
|
There Were Climate Variations Before Humans Started Influencing the System. Example: The Medieval Warm Period and The Little Ice Age
The Medieval Warm Period Climate:
When: ~850-1250 CE Where: Strongest evidence in Europe, possibly worldwide Evidence:
|
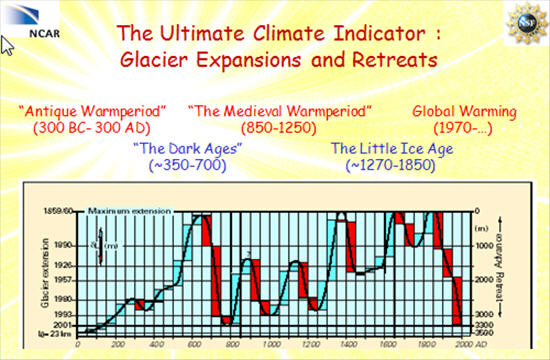
Glacier Expansion and Retreats
Credits: Courtesy Caspar Ammann
The Little Ice Age
Climate:
- Temperatures are thought to have been 1-1.5 degree C cooler than those of the twentieth century
- Not a true ice age- ice sheets did not grow
- Winter temperatures may have been more affected than summer
When: ~1270-1850 CE
Where: Europe, possibly worldwide but Southern Africa and Antarctic Peninsula were relatively warm
Evidence:
- Alpine (mountain) glaciers advanced worldwide
- Fur trappers record that southern Hudson Bay was frozen for about 3 weeks longer
- North Atlantic sea-ice advanced
- Severe losses of livestock and famines in Scotland
- Eskimos seen off the coast of England
- Crop yields fell
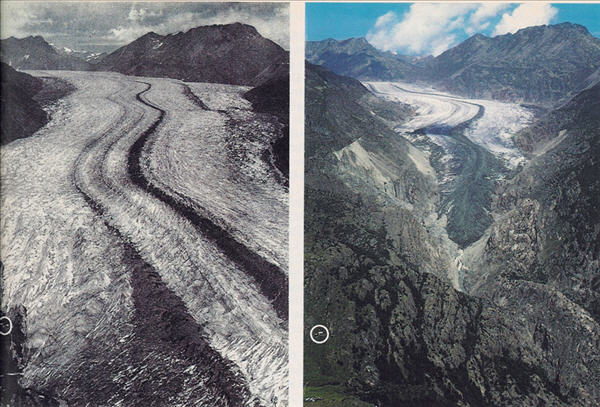
The Great Aletsch Glacier (Grosser Aletschgletscher) in Switzerland, photographed from approximately the same location in 1856 (left) and 1987 (right). Notice the hut circled in the lower left.
Credits: Courtesy Caspar Amman
What Caused the Climate Variations of the Medieval Warm Period and the Little Ice Age, Prior to Anthropogenic Influence?
Solar variability
| Solar variability likely contributed to the initiation of the Little Ice Age. The Sun's output correlates with the number of sunspots (dark circular regions on the Sun's surface). More sunspots occur when the Sun's radiation is at a maximum, fewer when the radiation is at a minimum. The Little Ice Age correlates with a time of few sunspots and probably less solar radiation. The solar section of this course covers the effects of solar variability in more detail. |
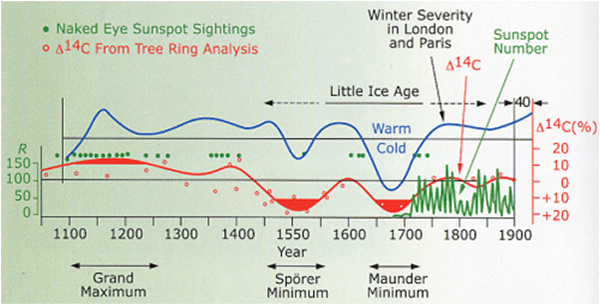
Sunspot and Carbon-14 data compared to winter severity in London and Paris from 1100 to 1900 CE.
Credits: Courtesy Caspar Amman
Volcanic eruptions
Volcanic eruptions punctuated the changes brought on by solar variability. Examples of historic eruptions and their effects are provided below.
|
1815: The Year Without a Summer In 1815, a volcano called Tambora, located in Indonesia, exploded. This is the largest volcanic explosion in recorded history. The large amount of sulfuric acid aerosol in the stratosphere generated by the eruption is thought to be the main cause of the lack of summer in the Northern Hemisphere during the following year. 1816 became known as "the year without a summer" in Europe. The climatic cooling even affected the literary arts of the time. During that summerless summer, Mary Shelley, her husband poet Percy Bysshe Shelley, and poet Lord Byron were on vacation at Lake Geneva. Constant rain and gloomy skies, effects of the volcanic eruption, trapped them indoors for days during which Mary Shelley wrote Frankenstein and Lord Byron wrote the poem Darkness . Both of these literary works describe a bleak, dark environment reflective of the climatic condition of the time. I had a dream, which was not all a dream.
|
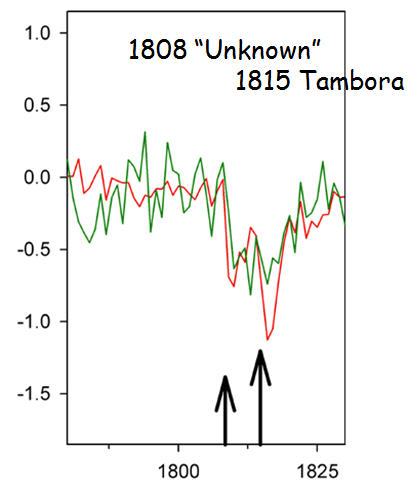
Two computer models (redline is NCAR's CSM) reflect the drop in temperature due to two volcanic eruptions, one in 1808 and the other in 1815.
Credits: Courtesy Caspar Ammann
1883: Krakatau
Within two weeks of the eruption of Krakatau in the Pacific Ocean, clouds of sulfate aerosol had circled the Earth, affecting sunsets for more than two years! The Sun appeared blue-green in color through the haze. The eruption had generated 30-70 metric tons of sulfate aerosols in the stratosphere. Krakatau was the loudest volcanic explosion in recorded history. The explosion was heard at a distance of 4653 km from the volcano and created a 6km-wide crater as it ejected more than 10 cubic kilometers of rock and 20 cubic kilometers of tephra 35 to 50 kilometers vertically into the atmosphere.
What We Know About Natural Forcings in Climate Models
Using the same approach to force the global climate model with solar and volcanic forcing, we can simulate the climate of the last Millennium relatively well. Thus, it is unlikely that we underestimate solar forcing in the 20th century. According to the models, a combination of solar variability and volcanic eruptions can explain much of the climate change during the Medieval Warm Period and Little Ice Age. The same models can not explain recent global warming solely by solar variability and volcanic eruptions. Thus, there must be another factor forcing the climate system though the last 150 years. In fact, models can accurately describe most recent climate variability when anthropogenic forcing is included with solar and volcanic forcing.
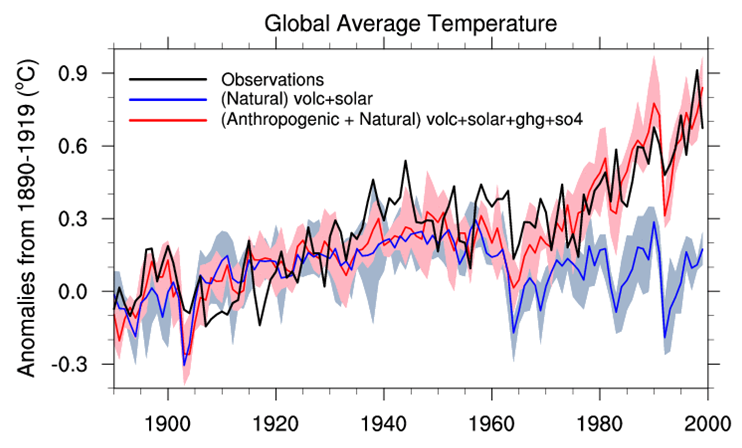
The figure below is often used by NCAR scientists to explain our understanding of how both natural and anthropogenic forcings must be used to account for the observed changes in global temperatures during the last century.
The black line in the figure below represents actual observations of the global average temperature from 1880 through 2000. These observations were taken using thermometers and represents an objective measurement of temperature change.
The blue line represents the mean temperatures derived from an ensemble of NCAR global climate model experiments that focused on our understanding the known natural forcings, such as solar variability and volcanism. The light blue area represents the variability in the individual model runs. If, as some critics claim, natural forcings are the sole cause of global warming, the blue line should follow the black line. This is obviously not the case past about 1980, therefore natural forcings cannot responsible for the observed changes since then.
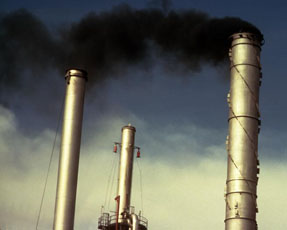
The red line represents the predicted mean temperature derived when the models were adjusted to include both natural and anthropogenic forcings, such as greenhouse gases and aerosols. The light red area indicated the variability in these model runs. It is clear that the results that include anthropogenic forcings more closely match the observations and thus indicate that we are responsible for global warming.
|