Compare Regional Climate Projections Side-by-side
Use the popup menus along the top edge of this interactive (below) to choose a pair of maps to view side-by-side. For example, try comparing:
- temperature change in North America vs. precipitation change in North America
- temperature change in South America as compared to temperature change in Africa
Credits: Images courtesy of the IPCC (AR4 WGI Chapter 11 Supplementary Materials figures S11.5 through S11.20).
These maps depict projections of future climate in various regions of the world. You may choose from eight different regions, and can display either changes in temperature or changes in precipitation.
These projections represent averages from 21 different climate models. They show how much change is expected near the end of the 21st century as compared to late 20th century values. Specifically, the maps show the projected average values for the years 2080 to 2099 as compared to the average values a century earlier (1980 to 1999).
- The maps showing temperature have a scale running from -1° C. (that is, a decrease in temperature of 1°) to +10° C.
- The maps showing precipitation have a scale running from -50% (a 50% decrease in precipitation) to 50% (a 50% increase in precipitation).
You might also be interested in:
Leaders from 192 nations of the world are trying to make an agreement about how to limit emissions of heat-trapping greenhouse gases, mitigate climate change, and adapt to changing environmental conditions.
...more
Climate in your place on the globe is called regional climate. It is the average weather pattern in a place over more than thirty years, including the variations in seasons. To describe the regional climate
...more
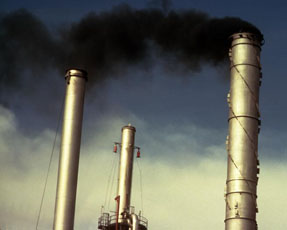
Less than 1% of the gases in Earth's atmosphere are called greenhouse gases. Even though they are not very abundant, these greenhouse gases have a major effect. Carbon dioxide (CO2), water vapor (H2O),
...more
Television weather forecasts in the space age routinely feature satellite views of cloud cover. Cameras and other instruments on spacecraft provide many types of valuable data about Earth's atmosphere
...more
Predicting how our climate will change in the next century or beyond requires tools for assessing how planet responds to change. Global climate models, which are run on some of the world's fastest supercomputers,
...more
The world's surface air temperature increased an average of 0.6° Celsius (1.1°F) during the last century according to the Intergovernmental Panel on Climate Change (IPCC). This may not sound like very
...more
A factor that has an affect on climate is called a forcing. Some forcings, like volcanic eruptions and changes in the amount of solar energy, are natural. Others, like the addition of greenhouse gases
...more