

Climate Modeling
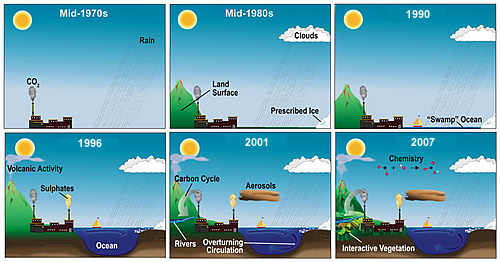 |
These diagrams depict how climate models have evolved since the 1970s. Models have grown increasingly sophisticated, incorporating clouds, land surface features, ice, and other elements into their calculations. Simple oceans were included around 1990. Current climate models include clouds, atmospheric chemistry, vegetation, and other features. (Click for larger version.) |
Global climate models (GCMs) use mathematical equations to describe the behavior of factors of the Earth system that impact climate. These factors include dynamics of the atmosphere, oceans, land surface, living things, and ice, plus energy from the Sun. Sophisticated climate models are increasingly able to include details such as clouds, rainfall, evaporation, and sea ice. Thousands of climate researchers use global climate models to better understand the long-term effects of global changes such as increasing greenhouses gases or decreasing Arctic sea ice. The models are used to simulate conditions over hundreds of years, so that we can predict how our planet's climate will likely change.
Click here to view an interactive diagram of the types of elements modern climate models contain; you can move your cursor over portions of the image to see descriptions of those elements. This diagram describes NCAR's CCSM (Community Climate System Model), but the principles apply to other climate models.
"Resolution" is an important concept in many types of modeling, including climate modeling. Spatial resolution specifies how large (in degrees of latitude and longitude or in km or miles) the grid cells in a model are. Temporal resolution refers to the size of the time steps used in models; how often (in simulated or "model time") calculations of the various properties being modeled are conducted (12-hour time steps are typical).
Spatial Resolution
Although we know that traits like temperature vary continuously over the surface of the Earth, calculating such properties for the entire globe is beyond the reach of even the fastest supercomputers. Instead, a climate model places "virtual weather stations" at intervals around the modeled Earth and reports the calculated properties at each station. Models use grids of "cells" to establish the locations of the "virtual weather stations." A typical climate model might have grid cells with a size of about 100 km (62 miles) on a side. The "virtual weather stations" are located at the corners of the grid cells.
Models can be generated with higher or lower resolutions. The grid cells could be reduced in size to 50 km. This would mean that more cells cover Earth's surface, increasing spatial resolution. Or the grid cells could be enlarged to 200 km. This would mean fewer grid cells and decreased spatial resolution. More, smaller cells increases the amount of computing time because there are more "virtual weather stations" at which atmospheric variables must be calculated. Higher resolution models provide much more detailed information, but take lots more computing time. As a general rule, increasing the resolution of a model by a factor of two means about ten times as much computing power will be needed (or that the model will take ten times as long to run on the same computer).
Models grids for atmospheric (including climate) models are three dimensional, extending upward through our atmosphere. Early climate models typically had about 10 layers vertically; more recent ones often have about 30 layers. Because the atmosphere is so thin compared to the vast size of our planet, vertical layers are much closer together as compared to the horizontal dimensions of grid cells. Vertical layers might be spaced at 11 km intervals as compared to the 100 km intervals for horizontal spacing.
|
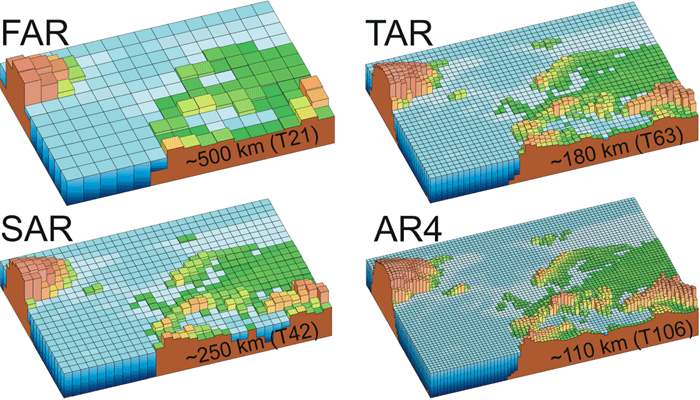
These images illustrate the typical spatial resolution used in state-of-the-art climate models around the times of each of the four IPCC Assessment Reports. In 1990, many climate models used a grid with cells of about 500 km (311 miles) on a side. In 1996, resolution had improved by a factor of two, producing grid cells 250 km (155 miles) on a side. By 2001, grid cells has, for the most part, been reduced to about 180 km (112 miles), while models run in 2007 typically used a 110 km (68 mile) wide grid cell. Vertical resolution is not depicted in these images, but has also improved over the years. Typical FAR models had a single-layer "slab ocean" and 10 atmospheric layers; AR4 models often include 30 layers in the oceans and another 30 in the atmosphere. (Click for larger version.)Credits: Image courtesy of the IPCC |
|
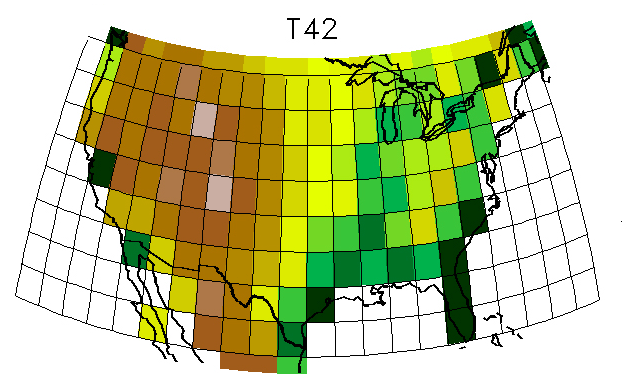
The frames of this animation illustrate spatial resolution of a model. The lowest resolution grid shown here, T42, which covers most of the entire state of Florida with just two large grid cells, was typical of model resolution in the mid-1990s. It has grid cells of about 200 by 300 km (120 by 180 miles) at mid-latitudes. The T85 resolution is typical for current models. Its grid cells are about 100 by 150 km (60 by 90 miles) across at mid-latitudes.The highest resolution examples, T170 and T340, represent future directions in modeling as new, more powerful supercomputers come online in the years ahead. Such models will be able to produce projections for regional climates that will be much finer than those we can currently generate. (Click for larger version.)Credits: Images courtesy of Warren Washington, NCAR. |
Temporal Resolution
Just as modelers must decide how close together in space to put the "virtual weather stations" at grid intersections, they must also decide how close together in time (that is, "virtual" or "model world" time) to make their calculations. As is the case with spatial resolution, computing-time increases as temporal resolution increases, so if conditions in the model world are calculated too frequently, the model takes a very long time to run. However, if too much "model world" time passes between calculations, the model becomes inaccurate.
Climate models are typically run with time steps of about 30 minutes. A climate model run for a century might, therefore, involve 1,753,152 (the number of half-hours in a century) time steps. All model parameters (temperature, wind speed, humidity, etc.) would be calculated at each of the thousands to millions of grid points in the model at each of those time steps. That's a lot of calculating... sounds like a job for a supercomputer!
A model is often run for several "model years" before the time frame of interest to allow the modeled system to become stable before scientists introduce conditions that alter the system, such as increased levels of carbon dioxide.
Uncertainty: Scientific and Social
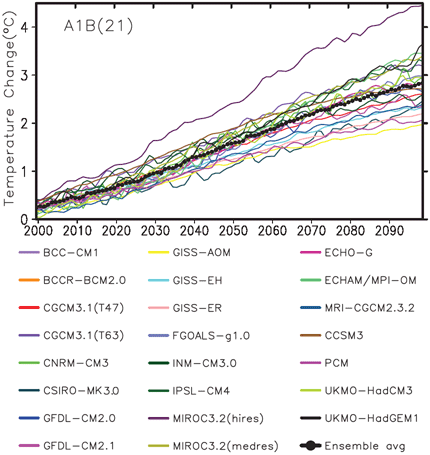
Graph showing predicted global temperatures between 2000 and 2100 according to more than 20 different climate models (various colors) . The black dotted line is the average of all the models. (Image courtesy of IPCC AR4) |
When using computer models to make predictions about future climate, there are two major sources of uncertainty:
- Scientific sources of uncertainty - Though observations, theory, and climate models continue to improve, Earth's climate is an immensely complex system. Any attempt at predicting future climate is bound to have at least a few uncertainties about the science involved.
- Uncertain future behaviors of humans - At what rate will world and regional populations continue to grow? What mix of renewable and fossil fuels will people use for energy in 10, 20, or 50 years time? Will people rely more on automobiles or public transportation to get around? Assumptions about the answers to such questions influence predictions of future climate change.
Scientific sources of uncertainty are addressed in IPCC reports (see this week's reading about the IPCC) by reporting the findings of many similar, but different, climate models. In the Fourth Assessment Report, results from 23 different climate models were reported in most cases. Take a look at the graph at the right to see an example of predictions from different climate models.
Most of the big unknowns about how Earth's climate will change in the future are due to the fact that we are not sure how humans will change their behaviors in the future. The IPCC deals with uncertain future behaviors of humans by making several different predictions of future climate that assume different amounts of human impact on the climate system in the future. These scenarios are a way to make a range of predictions of future climate change based on a range of ways that humans may live, work, and populate the Earth in the future. Climate models are run with the scenario assumptions to make predictions. This means that each model run becomes more or less an "if-then" statement such as: "if humans were to act this way, then Earth's climate would warm by this much."
There are four different scenarios used by climate models described in IPCC reports. The main scenario groups are named A1, A2, B1, and B2. (There are also a few subdivisions of the A1 scenario.) Are you lost in this alphabet soup yet? Below are some illustrative (but not comprehensive) descriptions of the assumptions made by the major scenarios. The scenarios are pretty complex, so this is just a broad overview.
- A1 scenarios: assume rapid economic and technological growth, a low rate of population growth, and a very high level of energy use.
Disparities between "rich" and "poor" countries narrow.
- The A1FI scenario is based on high levels of fossil fuel use for energy.
- The A1T scenario assumes non-fossil energy sources will predominate.
- The A1B scenario presumes that a balance of fossil and non-fossil fuels will be used for energy.
- A2 scenario: assumes high population growth, that technological change and economic growth will be slower and more disparate (between countries and regions) than in other scenarios, and that energy use will be high.
- B1 scenario: assumes a high level of environmental and social consciousness which leads to sustainable development, low population growth, high economic and technological advancement, and low energy use. Area devoted to crops and grasslands decreases, while reforestation efforts expand forests.
- B2 scenario: similar assumptions to the B1 scenario in that it also assumes a more sustainable and environmentally conscious world economy and society. However, there are more disparities between industrialized and developing nations in this scenario. Technological and economic growth is slower than in B1, and population growth is greater (though still less than in A2). Energy use is midway between B1 and A2. Changes in land use are also less dramatic than in B1.
Note: The word "assumption" sometimes gets a bad rap. Making assumptions about other people can lead to racist/sexist/ageist remarks. In science, however, assumptions are often critical. And it's very important to be up front about what a particular scientific study assumes and what it tests.
Select one of six IPCC scenarios for possible future climate to see carbon dioxide emissions, CO2 atmospheric concentration, and modeled temperatures through 2100 for each of the scenarios.
Image courtesy of the IPCC |
Resources to Explore:
Windows to the Universe Articles About Modeling
The following four pages provide a basic overview of climate models. They are also written at a level suitable for the general public.
- Modeling the Future of Climate Change
- What Is a Climate Model?
- How Climate Models Work
- Accuracy and Uncertainty in Climate Models
Climate Model Video
This short video segment (2 min. 14 sec.) illustrates some of the basic elements of Global Climate Models (GCMs), including the construction of a grid upon which the model's calculations are based.
- Higher resolution version of the video (14 MB)
- Lower resolution version of the video (4.1 MB)
- Right-click on either link above, then "Save as..." to save the video file to your computer if you are having trouble viewing it over the Internet.
Scenarios Highlighted in IPCC Reports:
For more information about how scenarios are used in climate modeling, take a look at these IPCC resources.
- Chapter 4 "An Overview of Scenarios" from the IPCC's "Special Report on Emissions Scenarios" (SRES)
- Section 3.1 "A1 Storyline and Scenario Family"
- Section 3.2 "A2 Storyline and Scenario Family"
- Section 3.3 "B1 Storyline and Scenario Family"
- Section 3.4 "B2 Storyline and Scenario Family"
- Section 4.2 Table 4-4 Main driving forces for the four scenarios (population, economic growth, energy use, land use, etc.)
- One-page summary of Emission Scenarios on page 18 of the AR4 Working Group I Summary for Policymakers


