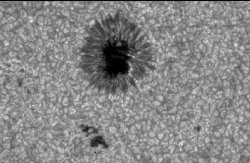
Plotting Sunspot Activity
An activity adapted from Rice University-Houston Museum of Natural Sciences, Summer Solar Institute, Being a Solar Astronomer
Type of Lesson: Investigation with evaluation worksheet
Time Needed: 45 minutes
Standards Addressed
MEGOSE ES5 Describe and explain common observations of the day and night skies.
MEGOSE ES7 Compare our sun to other stars and star systems.
MEGOSE ES8 Explain common observations of the day and night sky.
Quick Summary of Lesson
Students will learn how to graph sunspots, also called active regions (AR's), on the Sun using a solar graph. They then can make generalizations about where sunspots usually occur on the Sun.
Materials
pencil
Student Activity sheet (found below)
Procedure
1. Have students print out and complete the Student Activity sheet (located below).
Student Activity Sheet
Please click here for student activity sheets. All activities on the Windows to the Universe site may be printed and reproduced if being used for educational purposes.
Notes to the Teacher
The solar graph has east on the left and west on the right because it is arranged the way the face of the Sun appears to an observer on the Earth. The information given is from the USAF/NOAA solar region summary for July 4, 1991. This particular day was chosen only because there were several AR's shown for that day. AR's receive their identification number in the order in which they are seen. This numbering system began several hundred years ago. The student should notice that most of the AR's are within about 20 degrees of the Sun's equator.
Possible extensions for this activity include:
Have students read the pages on sunpots and on Maunder's Butterfly diagram. Students should gather this rough association from the reading: during the first years of a solar cycle (near solar minimum), most sunpots appear at higher latitudes between 35 degrees and 20 degrees. During the years moving towards solar maximum, sunspots appear closer and closer to the equator at 20 degrees or less. Have students guess when their plot occurred - closer to solar maximum or closer to solar minimum? Try to get a class consensus. Knowing the AR's listed were for July 4, 1991, you can now check their guess with this plot. You'll see 1991 is closer to solar minimum, but not by much. In fact it appears almost in the middle of that cycle, which explains any disagreements your students may have had.
Have students complete the Tracking an Active Region activity so they can learn how a single active region moves across the face of the Sun.
Need More Information? Try Using Windows to the Universe
Please use these links for further ideas or more information:
Graphing Sunspot Cycles another classroom activity
The Photosphere
Tracking an Active Region another classroom activity
Solar Activity
The Solar Cycle
The Sun
Sunspots
Last modified prior to September, 2000 by the Windows Team
The source of this material is Windows to the Universe, at http://windows2universe.org/ from the National Earth Science Teachers Association (NESTA). The Website was developed in part with the support of UCAR and NCAR, where it resided from 2000 - 2010. © 2010 National Earth Science Teachers Association. Windows to the Universe® is a registered trademark of NESTA. All Rights Reserved. Site policies and disclaimer.
