

Changing Planet: Permafrost Gas Leak
| Summary: |
Students investigate the characteristics of permafrost and investigate permafrost borehole data to learn about recent changes in the permafrost. They analyze the changing concentrations in atmospheric methane and correlate the change to thawing permafrost. |
Materials:
|
| Source: |
Developed by NESTA/Windows to the Universe team members Missy Holzer, Jennifer Bergman, and Roberta Johnson. |
|
| Grade level: |
7-10 |
|
| Time: |
|
|
|
Student Learning Outcomes:
|
|
|
| Lesson format: |
Research and data interpretation |
|
| Standards Addressed: |
|
DIRECTIONS:
- For background information on permafrost and methane watch Changing Planet: Thawing Permafrost and Methane. Also explore these topics on the Windows to the Universe website at the links listed below.
- Depending on time and interest this lesson can be done in its entirety or it may be done in pieces. The student worksheet has been set up to facilitate these lesson options. Gather all the materials and print out one Permafrost Gas Leak worksheet per student, and one Alaskan Borehole Data Sheet per pair of students. This activity works best with students working in pairs so that they can assist each other with the mapping tools and with data interpretation. Ensure Google Earth is installed and working properly on student computers, and the Google Earth NSIDC permafrost layer and the University of Alaska, Fairbanks Permafrost Laboratory Site Layer are accessible for this lesson.
- Most students do not know what permafrost is, especially those living in lower latitudes. To facilitate an understanding of permafrost, set up a demonstration that models permafrost. Cut the tops of 4 1-liter soda bottles in order to create clear cylinders with bottoms. Fill one bottle two-thirds with moist soil, a second bottle with wet soil, and the last 2 bottles with a water-soil mixture that has a higher percentage of water. Place all four bottles in the freezer overnight to allow time for the material to freeze. Take them out of the freezer the next day, and carefully cut off the bottom 3 centimeters of the bottle and slide the remaining plastic bottle down to cover the "exposed" permafrost. Also make small slits on the sides of the bottles to allow for drainage. Place the bottles on your desk sitting in a clear pan to collect the drained water. Use these bottles to begin the discussion about the characteristics of permafrost, and what would happen if the bottles were left outside the freezer for an extended period of time. Next, ask students to hypothesize about the role of the "active" layer in insulating the layers below the surface. Add dry soil to top of one of the water-soil mixtures, and compare the thaw rate of each bottle. To model what would happen should the permafrost thaw, place a clay house on toothpicks or another object on the surface of each permafrost model and observe changes in its position with thawing of the permafrost. Mention that the active layer may consist of organic matter and that there may be organic matter in the permafrost layers. Should the permafrost layer thaw, the buried organic matter will begin to decompose, and release gases such as methane in the process.
- Part 1: Instruct students to visit the NSIDC Frozen Ground website to read and gain an in-depth understanding about permafrost. The key characteristics of this topic for students to focus on are temperature with depth, composition of the permafrost, and the spatial distribution of the various types of permafrost. Review student responses given on their worksheets.
- Next students will use the Arctic Portal Mapping Tool to explore Arctic boundaries and the extent of the different types of permafrost. Allow students about 10 minutes to manipulate the program and gain a level of comfort in using it before beginning their investigation. Close Part 1 of this lesson with a review of their work and assessment of their spatial awareness of permafrost.
- Part 2: Ask students to open the Google Earth NSIDC permafrost layer. After they explore this layer, have them open the Permafrost Laboratory Site Layer. The KML file can be found on the Permafrost Laboratory Site Layer website. It is above their map of site locations; simply click on it and it will open on top of the NSIDC permafrost layer. Students will explore borehole data and plots from three locations in Alaska to identify variations in temperature over the years. They will also correlate the locations of the data with the NSIDC Google Earth permafrost layer to determine which permafrost zone the data is from, and if the data is characteristic of that zone. It time is available have students create a graph of their data. If computer access is limited or unavailable, the borehole plots may be printed for students.
- Part 3: Most students are aware that carbon dioxide and water vapor are greenhouse gasses, but may not know that methane is also a greenhouse gas. To model the role of methane in global climate change, set up the Green House Gases lab from the USGS as a demonstration (or if time and materials are available as a student lab) in which bottles of dry air, carbon dioxide, water vapor, and methane are heated with a lamp and temperatures are recorded. Review the carbon cycle and key terms such as "sources" and "sinks" and "reservoirs" to remind students of how important it is maintain a balanced cycle. Through their exploration of the data in this part of the lesson they will understand what could happen should a typical sink in the carbon cycle switch to being a source in the carbon cycle. This switch is the concern of climate scientists should the permafrost continue to warm.
- Close the lesson with a discussion about the sensitivity of the polar regions to climate change. Since many people are unaware of this fact, ask pairs of students to develop an advertising campaign to raise awareness of this issue.
ASSESSMENT:
Assess student abilities to analyze maps and data plots, as well as synthesize and apply information drawn from multiple lines of data.
LAB SAFETY:
Always use safe laboratory practices.
CLEAN-UP:
Clean and store all lab materials for future use.
EXTENSIONS:
- Students could make their own permafrost using varying combinations of water and soil, and maybe even organic matter such as leaf litter. If the students use saran wrap to wrap the bottoms of thermometers to create a pocket, then they can create a borehole in their permafrost model. Place the wrapped thermometer into the bottle before filling in, and then fill the bottle with a soil-water mixture. Carefully remove the thermometer and the saran wrap will remain in place while the mixture freezes. Replace the thermometers after removing the bottles from the freezer. If the soil-water mixture is too wet, then freeze the mixture with the thermometer, and remove it once the mixture has set. To turn this into an inquiry-lab, have students develop a question and hypothesis before they create and test their models. Possible questions for them to explore include: Would adding extra water to the soil before it is frozen make it stronger or weaker? How long does it take for liquid water to melt its way through a thick layer of frozen soil? How much stronger is frozen soil than thawed soil? Students should make observations and measurements (e.g., using thermometer in borehole) to support or disprove their hypothesis.
- For advanced students, allow them to create their own investigation of changes in the spatial and temporal distributions of greenhouse gases. Assist them in developing a researchable question based on the data available from the NOAA Earth System Research Laboratory Interactive Atmospheric Data Visualization tool. Coach students in how to access and analyze the data. Allow them to report their findings to the class "research council."
- An alternative GIS-type interface that can be used to explore the Arctic and permafrost is Arctic Portal. The contents of this mapping tool can be used for rich research projects as students turn on and off multiple layers of scientific, economic and social data, and use the measuring tools to quantify the data in meaningful ways.
- To understand the seasonal variations within the active layer of permafrost, students can investigate the borehole data from University of Alaska Fairbanks Permafrost Outreach Program. Open the Google Earth file called "permafrost network kmz" in Google Earth and click on the pushpins at various locations to acquire the borehole data. There are an overwhelming number of schools participating in this project, and therefore you may want to select the locations and present the data to the students in a printed document.
- Students can explore a Russian permafrost dataset found at NSIDC Classroom Activities.
BACKGROUND INFORMATION:
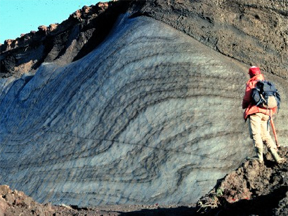
When the ground under your feet is frozen, interesting things can happen. The land may be covered with circles, polygons, or stripes, called patterned ground, which form as the land freezes. Trees may be few and far between, their roots unable to penetrate the solid ground, leaving the land to only the short tundra plants or no plants at all. Unique hills called pingos, made mostly of underground ice, may dot the landscape, growing larger over time if more ice is added to their core. Or big blocks of land that were once flat may be thrust upward like detached puzzle pieces in areas called blockfields.
That frozen ground is called permafrost. Permafrost can have different characteristics and be found in different forms. It can contain organic-rich soil or be sandy and rocky. It can even be solid rock. It may contain frozen water or be relatively dry. But all permafrost has one important characteristic in common. It is frozen. Permafrost is ground that is below the freezing point of water (0°C or 32°F) for two or more years. Permafrost is found at high latitudes like the Arctic and Antarctic. It is also common at high altitudes - like mountainous areas – wherever the climate is cold. Today about 20% of the land surface is frozen permafrost. Permafrost is considered part of the cryosphere because it is frozen. However, it is also often considered part of the geosphere because it contains rocks and soils.
The top surface of permafrost - called the active layer – usually thaws and refreezes with the seasons. The active layer may only be half a meter thick or it may be as much as four meters thick. Plants can survive if there is an active layer because their roots can penetrate the softened active layer and they can find the water they need to survive. The following photo shows the range in temperatures experienced at different depths in the ground during the year. The active layer (shown in grey) thaws each summer and freezes each winter, while the permafrost layer remains below 0°C.
Courtesy of the Geologic Survey of Canada
In some areas of the world, permafrost extends very far underground. Under Barrow, Alaska (US), there is 440 meters of permafrost and in areas of Siberia (Russia) the permafrost is about a kilometer and a half thick. It took a long time for the ground to freeze to such depths. Shallower permafrost can form relatively quickly; the first hundred meters of ground can freeze in only several hundred years. But it took a much longer time, tens or even hundreds of thousands of years, for ground to freeze to depths of several hundred meters. For example, in a mere 350 years of cold climate the ground can freeze to about 80 meters depth, but it takes ten times as long to freeze to about 220 meters depth. Scientists estimate that it took more than half a million years for the deep permafrost underlying Barrow, Alaska to form.
Compared to the long time it took to form, permafrost has been thawing relatively quickly in recent years. Scientists have found that the rate of permafrost thaw has increased because of global warming.
Temperature measurements taken in deep boreholes, such as those shown in the graph below, show that permafrost temperatures have increased significantly over recent years. Data like this has been collected from permafrost-covered lands (and ocean floors) in northern North America, Europe and Asia over the past 50 years. The data from different locations shows similar trends toward permafrost thaw over time, and the thawing trend appears to be accelerating.
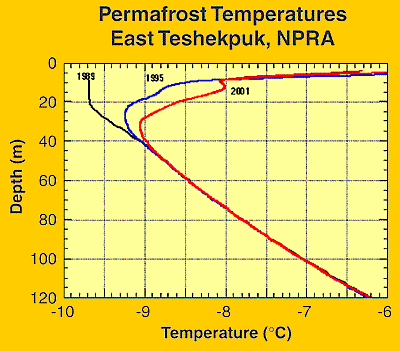
Courtesy of USGS
As permafrost thaws, the land, atmosphere, water resources, ecosystems, and human communities are affected. In some natural areas, forests have turned into wetlands filled with newly available water that was once trapped in the ice. The thawed ground is often less stable causing trees to topple and lean in odd directions. These areas are called drunken forests. Homes and other buildings built on frozen ground settle or collapse as the land thaws. More than 300 buildings in and around Fairbanks, Alaska (US), have been affected by thawing permafrost. When the ground thaws, coastal areas and hillsides are also vulnerable to erosion. Unstable slopes can pose a danger for human settlements and roads. The eroding ground can cause damage to pipelines too.
Thawing permafrost also causes a positive feedback to global warming. Permafrost is a sink for carbon. The carbon became trapped underfoot when the soils froze during the beginning of the last ice age in the Pleistocene. As permafrost thaws, carbon trapped within the once-frozen soils is released as methane (CH4), a powerful greenhouse gas. The methane released to the atmosphere is now a source of carbon and causes more global warming and more permafrost thaws. Thus, thawing permafrost actually speeds up global warming.
Most people know methane is a greenhouse gas, but many don't know that methane is a greenhouse gas more than 30 times more potent than carbon dioxide. It is released from previously frozen soils in two ways. When the organic material (which contains carbon) stored in permafrost thaws, it begins to decompose and, under anaerobic conditions, gradually releases methane. Methane can also be stored in the seabed as methane gas or methane hydrates and then released as subsea permafrost thaws. These releases can be larger and more abrupt than those that result from decomposition.
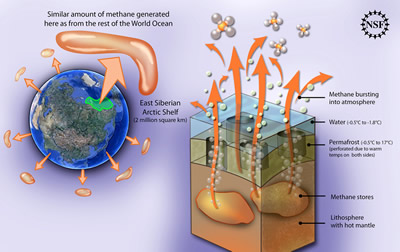
The illustration above shows the permafrost of the East Siberian Arctic Shelf under the ocean (an area of about 2 million kilometers squared). Recent studies have shown it is more porous than previously thought. The ocean on top of it and the heat from the mantle below it warm it and make it perforated like Swiss cheese. This allows methane gas stored under it (and thus under pressure) to burst into the atmosphere. The amount leaking from this locale is comparable to all the methane coming from the rest of the world's oceans put together.
Image Courtesy of Zina Deretsky, National Science Foundation
It is so important to continue monitoring these terrestrial and oceanic sources and reservoirs of methane and to understand the processes that cause methane to be a sink or a source. It is certain that methane will be a driving force in future global climate change.
RELATED SECTIONS OF THE WINDOWS TO THE UNIVERSE WEBSITE:
- Methane
- Methane Is Being Released Much Faster Than Previously Thought from the Arctic Ocean
- Cryosphere
- Earth's Polar Regions
- Warming of the Polar Regions
- Climate and Global Change
OTHER RESOURCES:
- NSIDC Frozen Ground
- NOAA Earth System Research Laboratory
- University of Alaska Fairbanks Permafrost Outreach Program
- NSF Arctic Methane Release Fact Sheet
- AAAS Methane Gas Release from Arctic Permafrost is Far Larger than Expected