A butterfly diagram of the latitude of sunspot occurrence versus time.
Click on image for full size
NASA's Marshall Space Flight Center
Maunder's Butterfly Diagram
Throughout the solar_cycle,
the latitude of sunspot
occurrence varies with an interesting pattern.
The plot on the left shows the latitude of sunspot occurence versus
time (in years).
Sunspots are typically confined to an equatorial belt
between -35 degrees south and +35 degrees north latitude.
At the beginning of a new solar cycle, sunspots tend to form at
high latitudes, but as the cycle reaches a maximum (large numbers
of sunspots) the spots form at lower latitudes. Near the
minimum of the cycle, sunspots appear even closer to the equator,
and as a new cycle starts again, sunspots again appear at
high latitudes. This recurrent behavior of sunspots gives
rise to the ``butterfly'' pattern shown, and was first
discovered by Edward Maunder in 1904. The reason for this
sunspot migration pattern is unknown. Understanding this pattern
could tell us something about how the Sun's internal magnetic
field is generated.
You might also be interested in:
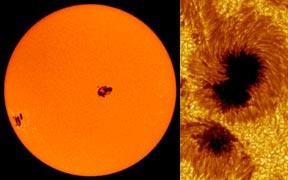
Sunspots are dark, planet-sized regions that appear on the "surface" of the Sun. Sunspots are "dark" because they are cooler than their surroundings. A large sunspot might have a central temperature of
...more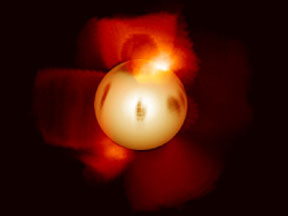
In recent years astronomers have become able to detect "starspots" on distant stars! Like the sunspots that frequently dot the "surface" of the nearest star, our Sun, starspots are relatively cool, dark
...more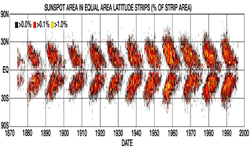
Throughout the solar_cycle, the latitude of sunspot occurrence varies with an interesting pattern. The plot on the left shows the latitude of sunspot occurence versus time (in years). Sunspots are typically
...more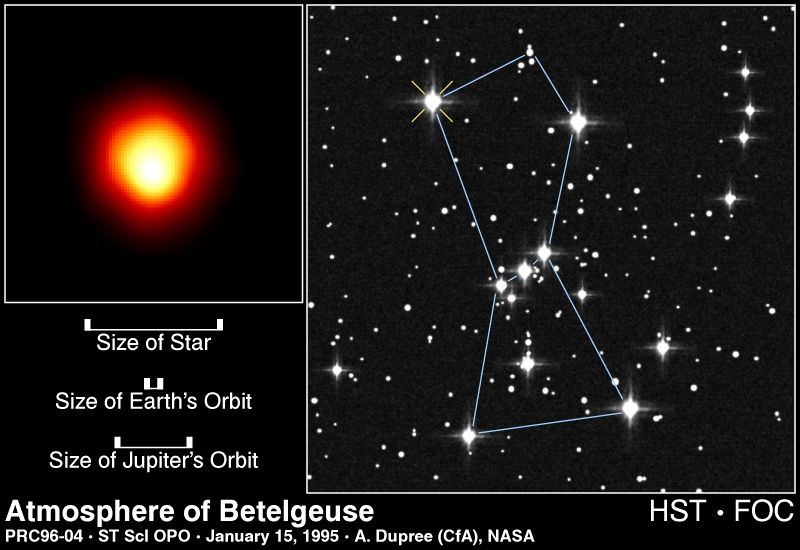
When the temperature in the core of a star reaches 100 million degrees Kelvin fusion of Helium into Carbon occurs (three Helium nuclei combine to form a nucleus of Carbon). In the same range of temperature
...more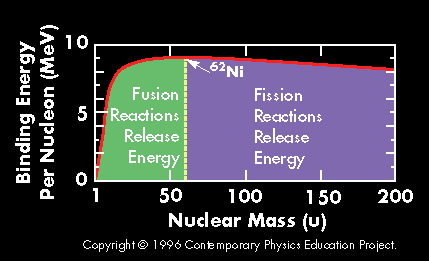
A plot of the binding energy per nucleon vs. atomic mass shows a peak atomic number 56 (Iron). Elements with atomic mass less then 56 release energy if formed as a result of a fusion reaction. Above this
...more
There are several experiments worldwide where the conditions for nuclear fusion reactions have been achieved in a controlled manner. The two main approaches that are being explored are magnetic confinement
...more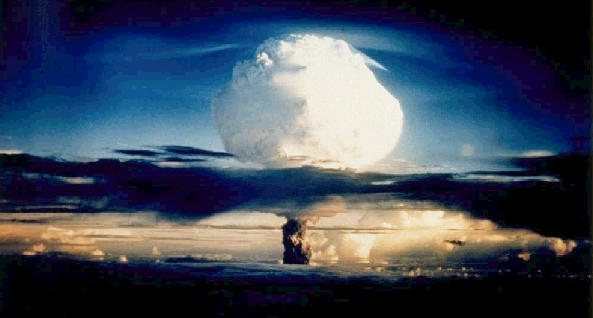
In the Hydrogen bomb the explosion of a nuclear fission charge (atomic bomb) produces the temperature and density necessary for the fusion of Deuterium and Tritium (isotopes of Hydrogen), resulting in
...more


