Animation of Annual Variation in Sea Ice Extent in the Southern Hemisphere
|
This animation shows the annual variation of sea ice extent in the Southern Hemisphere. Throughout the winter the cold temperatures freeze more and more of the water in the Southern Ocean, gradually building up a layer of ice on the surface that covers millions of square kilometers. This ice pack generally reaches its maximum extent around September.
As warmer temperatures arrive in the Antarctic in the springtime, the ice begins to melt and much of the ice pack breaks up. This continues throughout the summer, so the extent of the ice pack is usually at its minimum around February. Thereafter it begins growing again, repeating the annual cycle.
This animation shows seven years of this cycle, from January 2002 through December 2008.
(Note: If you cannot see the animation you may need to download the latest QuickTime player.)
|
Go to the NSIDC web site to:
You might also be interested in:
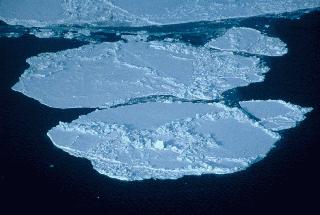
Sea ice is frozen seawater. It can be several meters thick and it moves over time. Although the salts in the seawater do not freeze, pockets of concentrated salty water become trapped in the sea ice when
...more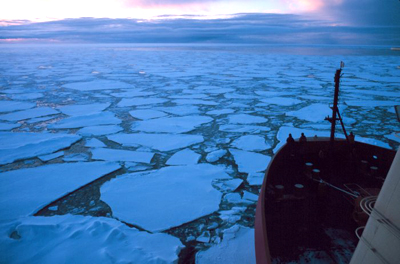
The Southern Ocean is a bit different. Many mapmakers do not even recognize it as an ocean. The Southern Ocean (sometimes known as the Antarctic Ocean or South Polar Ocean) surrounds Antarctica in the
...more
NASA's Earth Observatory has recently started making images of the entire surface of the Earth every month. There are no clouds in the images because they combine many pictures taken at different times
...moreThere are two oceans in Earths polar regions: the Arctic Ocean, which occupies most of the north polar region, and the Southern Ocean, which surrounds the continent of Antarctica in the south polar region.
...more
Dive into one of our new polar activities or games! Animation showing Annual Variation of Sea Ice Extent in the Arctic Animation showing Annual Variation of Sea Ice Extent in the Antarctic Changing Planet:
...more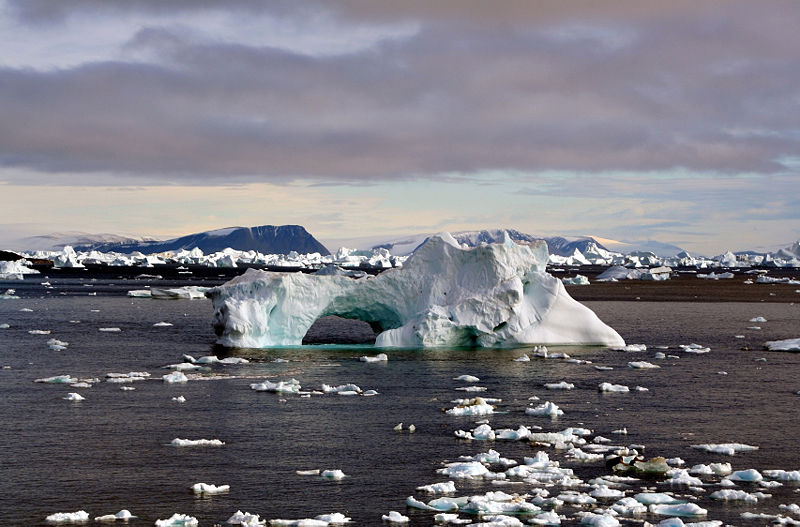
Many educators are now finding opportunities to teach about Earth's climate and climate change in their classrooms. Windows to the Universe provides an interlinked learning ecosystem to a wealth of resources
...more
Altocumulus clouds (weather symbol - Ac), are made primarily of liquid water and have a thickness of 1 km. They are part of the Middle Cloud group (2000-7000m up). They are grayish-white with one part
...more