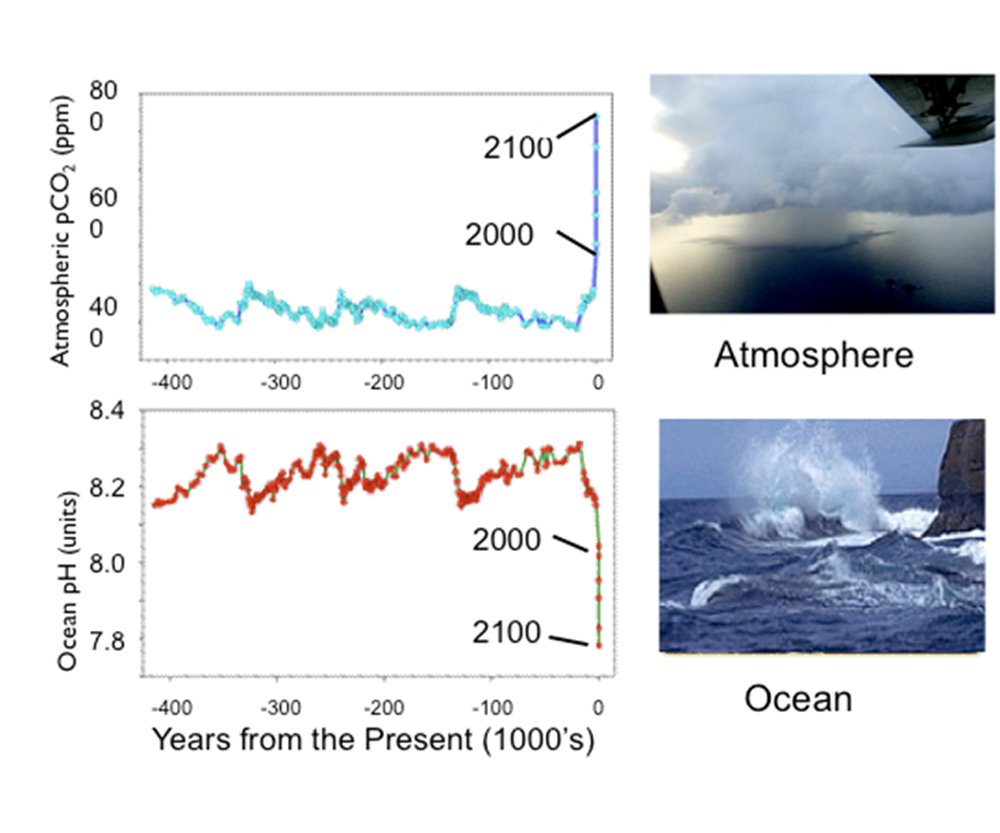
The top graph shows the variation of CO2 in the Earth's atmosphere over the last 400,000 years. You can see the blue line goes up and down with natural variations in levels of CO2 until just before Present where CO2 levels spike drastically upwards due to human contribution of the gas. Projected levels of CO2 are shown for 2100. On the bottom graph, the ocean's pH is shown. You can see that this inversely varies with the atmospheric CO2. You can see natural variations of the ocean's pH until just before Present, where the pH plummets from natural levels. Projected pH level is around 7.8 in 2100, much lower (more acidic) that the ocean is now.
Courtesy of Tim Killeen