Where are the paleoclimate proxy data?
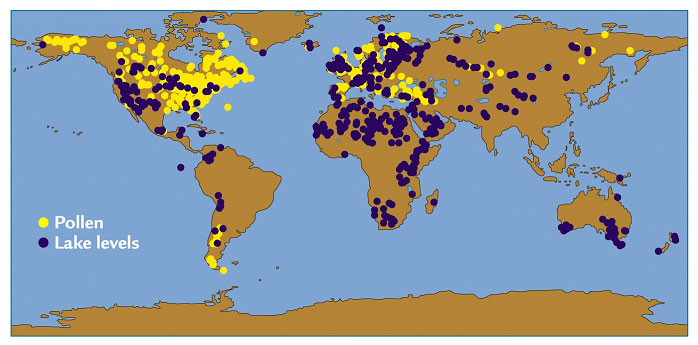 |
Yellow dots on this map indicate some of the many sites from which pollen samples have been collected for use as paleoclimate proxies. Purple dots indicate the locations of lake core sediment samples.
Courtesy of NOAA's Paleoclimatology Program/Department of Commerce. |
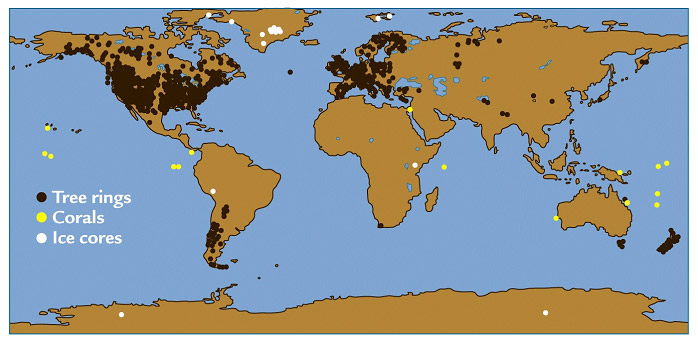 |
Yellow dots on this map indicate sites from which samples have been drilled from corals for use as paleoclimate proxies. Brown dots indiate locations of tree ring samples and white dots indicate locations of ice cores collected for paleoclimate analysis.
Courtesy of NOAA's Paleoclimatology Program/Department of Commerce. |
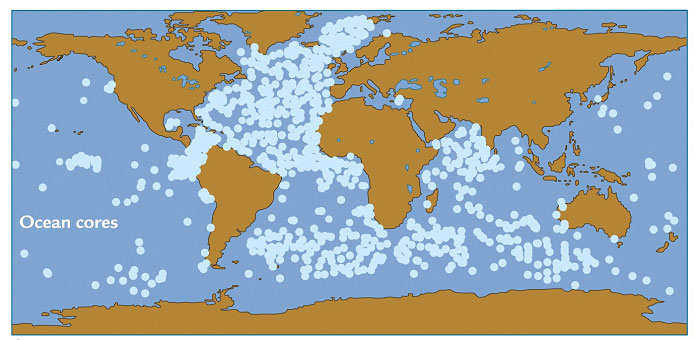 |
Blue dots on this map indicate sites from which cores of the sea floor have been drilled and analysed in paleoclimate studies.
Courtesy of NOAA's Paleoclimatology Program/Department of Commerce. |
Last modified June 15, 2009 by Lisa Gardiner.
You might also be interested in:
Looking for online content that can be used for a climate change education course or module? Pages linked below can be used to support an introductory climate change education for either a unit or a full
...more
Leaders from 192 nations of the world are trying to make an agreement about how to limit emissions of heat-trapping greenhouse gases, mitigate climate change, and adapt to changing environmental conditions.
...more
Climate in your place on the globe is called regional climate. It is the average weather pattern in a place over more than thirty years, including the variations in seasons. To describe the regional climate
...more
Less than 1% of the gases in Earth's atmosphere are called greenhouse gases. Even though they are not very abundant, these greenhouse gases have a major effect. Carbon dioxide (CO2), water vapor (H2O),
...more
Television weather forecasts in the space age routinely feature satellite views of cloud cover. Cameras and other instruments on spacecraft provide many types of valuable data about Earth's atmosphere
...more
Predicting how our climate will change in the next century or beyond requires tools for assessing how planet responds to change. Global climate models, which are run on some of the world's fastest supercomputers,
...more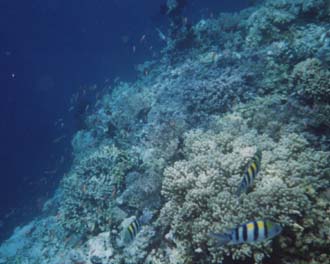
The world's surface air temperature increased an average of 0.6° Celsius (1.1°F) during the last century according to the Intergovernmental Panel on Climate Change (IPCC). This may not sound like very
...more