

How Do We Investigate Climates of the Past?
In order to understand climate and make educated future predictions, we need to understand how and why climate has changed throughout Earth history. Earth's climate has undergone a myriad of changes during the 4.6 billion years of Earth history. This week, we will focus on how scientists figure out how climate has changed through time.
Past climates can be grouped into three timeframes according to the types of data that are used to reconstruct climate conditions.
- The Instrumental Records "Era" - The period (the past 140 years approximately) when we have relatively precise, quantitative, direct measures of climate such as temperature, precipitation, and wind speeds.
- The Historical Records "Era" - Accounts of weather and climate span almost the entire period of recorded human history. Historical records include written accounts of droughts, floods, especially frigid winters, unusually hot summers, and storms as well as timing and quality of harvests and timing of seasonal changes. Such accounts lack the numerical precision of modern instrumental records, but span a much longer period of time. Historical records overlap with the timeframe of the "Instrumental Records Era".
- The Prehistoric "Era" of Paleoclimatology - also overlaps with the two more modern "eras", while plumbing the depths of the geologic history of Earth. Various types of data provide paleoclimatologists with information about the climates of ancient times. These types of data are called proxies. Tree rings, ice cores from Greenland and Antarctica, sediments from the bottoms of lakes and seas, and many other natural proxy records of climatic conditions help us piece together the story of Earth's climates before the time of recorded human history.
Types of Paleoclimate Proxies
Various types of paleoclimate proxies are used to understand past climate. Proxies span different periods of prehistory, provide different degrees of precision, and record different aspects of climactic conditions (temperature, precipitation, etc.) from one another. Taken together they provide many insights into climates of the distant past. A few of the main types of proxies used to interpret past climates are described below. In this week's case studies, we will cover two other common types of proxy records, tree rings and pollen records.
Several types of proxies have "layers" or "bands" or "rings". Each layer represents a fixed amount of time, often a year or growing season. Layers vary in thickness, color, chemical composition, and other traits, which indicate the climate at the time of formation. Proxy records with overlapping timeframes can be correlated to build up a chronology that spans a longer time period than does any individual piece of data. For example, by combining tree ring data from a tree that sprouted in the 1850s and was recently cut down with the ring pattern in a beam from a log cabin built in the 1870s, we might establish a proxy climate chronology that runs from the 1700s to the present day. This sort of splicing together of records is done with layers in ice cores, coral bands, and other proxies as well as tree ring data.
Two factors are used to describe types of paleoclimate proxy data: the span of the record and the resolution of the record.
- The span of a proxy record tells us how far back in time the record allows us to peer. For example, tree ring records span the most recent few thousands of years; ice core records go back as much as hundreds of thousands of years; and fossils can be up to hundreds of millions of years old. If we want to know what the climate was like during the Medieval Warm Period (10th to 14th centuries AD), tree ring data could be very useful. However, if we want to know what the climate was like as the dinosaurs were going extinct (around 65 million years ago), we'd need to use records with a longer span like sediments and fossils.
- Resolution describes the level of detail of a proxy record. Because many tree species 'record' conditions of each growing season, tree ring data can have an annual resolution. Ocean sediments, on the other hand, often have resolutions on the order of a century because sediments are mixed by currents and burrowing marine life, blending short-term trends.
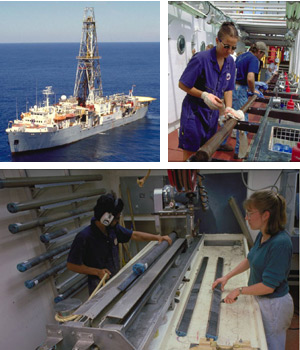
The ship JOIDES Resolution (top left) has recovered thousands of sediment cores from the ocean floor with a drilling rig. Scientists aboard the ship (top right) clean and prepare one of the 9.5 meter-long cores soon after it was pulled up from the deep ocean. The long cores are cut into shorter segments and split lengthwise down the middle. (lower) |
Typically, records that have large spans tend to have lower resolutions, while records with short spans tend to have higher resolutions. Scientists must be aware of spans and resolutions of different record types when looking for data about a specific time in history. The records must span the time period of interest, but they must also have appropriate resolution to address the issue being studied.
Sediments from Lakes Beds and Seafloors
The climate history preserved within layers of sediments that slowly accumulate on the bottoms of lakes and oceans can span hundreds of millions of years or longer. The resolution of these records is variable; it may be annual or on the order of a century or millennium. Sequences of sediments that are currently at the bottom of lakes or on the ocean floor are used to interpret climates of the recent past (see map). Rocks preserved on the continents that are thousands, millions, hundreds of millions, or even billions of years old are used to interpret the much more distant past.
Layers of sediments that form in lakes and oceans as sand, rock fragments, and soil erode from other areas and are deposited at the lake or ocean bottom. Typically, the sediment travels in rivers, which flow into lakes and oceans. As the moving water reaches a calmer environment, its suspended sediments fall to the bottom, gradually building up layer upon layer. Likewise, winds can bring sediments, volcanic ash, and pollen to the water. These items fall to the water surface and sink to the bottom. Skeletal materials from organisms and algae living within the water also 'rain' down to the bottom, particularly in deep-ocean environments. Until they are well buried, the uppermost layers of a sedimentary deposit are subject to disturbance by storms, earthquakes, currents, underwater landslides, and mixing by burrowing organisms, decreasing the resolution of the record.
Especially high-resolution annual records of climate are found in sediments from lakes that contain little or no life-sustaining oxygen. Without oxygen, burrowing animals can not survive and thus will not disturb the layers of sediment. Paired layers of sediments, called "varves", are laid down in alternating light and dark layers reflecting seasonal differences in runoff sediment composition (light-hued mineral-rich sediments versus darker sediments rich in organic materials).
Ice Cores
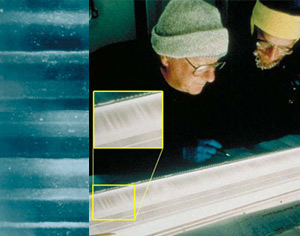
Scientists examine an ice core sample; inset shows layering (right). Closeup view of layers within a different sample; arrows indicate lighter summer layers (left). |
Ice cores can provide data with a yearly resolution, and some records span periods of hundreds of thousands of years. Continuous climate records embedded in ice form in areas where year-round cold temperatures prevent fresh accumulations of snowfall from melting in the summertime. Polar Ice Caps are obviously good locations for such accumulations, but high-altitude glaciers, even in low-latitude regions, can also be a source of ice cores. As layer upon layer of new snow builds up, the older layers on the bottom gradually get compressed transforming into a grainy material called firn and eventually to solid ice (at a depth of about 100 meters in Antarctic samples, for instance). This ice layer can become quite deep over time; the 25 million year old East Antarctic Ice Sheet is more than 4.5 kilometers thick in places.
The uppermost portions of an ice core have a layered structure that show yearly variation. Extreme pressure crushes the deeper ice layers together so tightly that individual years cannot be distinguished, though lower resolution climate variations can still be discerned. Typically, in ice samples from Polar Regions, the upper layers of ice have alternating light and dark layers. Light bands correspond to the relatively fresh, clean snows that fall in the summer when warmer conditions bring more moisture (and thus more precipitation) to these high-latitude locales. Dark bands mark the polar winter season, when little new snow falls on these frigid deserts and blowing snow is mixed with dust, discoloring the white snow. In many samples, the alternating light and dark layering is visible to the naked eye; in others, the layers can only be found by looking through polarized filters or via chemical analysis.
Most ice cores are collected from the vast ice sheets covering Greenland and Antarctica, which provide records spanning the longest time periods. The three kilometer thickness of ice in Greenland represent about 130,000 years of history dating back to the last interglacial warm spell (during which Greenland was ice-free). Even though the ice in Antarctica is thicker, up to 4.5 km, the oldest record from Antarctica dates back only about 740,000 years. This is because of different rates of snowfall in the different locations.
What is studied in the ice?
- The thickness of an ice layer provides clues about local precipitation; a thick layer corresponds to greater snowfall. Layer thickness also may tell us something about global temperatures since more snow tends to accumulate at the poles during global warm spells.
- Air pockets between the grains become cut off from each other and produce bubbles in the ice. Gas bubbles trapped in the ice provide data about atmospheric composition including the concentration of greenhouse gases.
- Aerosols (extremely fine particles) in the atmosphere prevent some solar energy from reaching the Earth's surface, causing cooling. Aerosols are carried by winds, settle upon snow, and become trapped within ice. These aerosols can include soot produced by burning, ash from volcanic eruptions, and dust from dust storms.
- Beryllium-10 concentrations, linked to cosmic ray intensities, are an indirect indicator of solar activity.
- The ratio of concentrations of two isotopes of oxygen in the water molecules in ice serves as an indicator of global temperatures. Oxygen has two commonly occurring natural isotopes, the usual 16O and the less common 18O, which has two extra neutrons. Water molecules that contain 18O are heavier than usual, so they do not evaporate from the ocean as readily as the regular water molecules. When the temperature of the ocean is warmer, however, more of the heavier water molecules are able to evaporate. Thus, ice formed in glaciers during warmer times has a higher concentration of 18O than ice formed during cooler times.
|
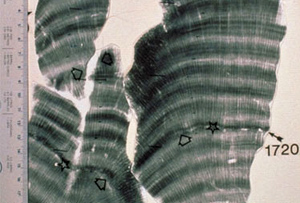
Most coral animals live in colonies that build massive, stony, calcium carbonate (CaCO3 limestone) skeletons over many years. The coral animals live on the surface of the skeleton and lay down layer upon layer of calcium carbonate beneath them over time. The layered structures that corals deposit as they grow have annual banding patterns reminiscent of those found in tree rings, ice cores, and lake sediments. Lighter-shaded layers appearing during the summer when growth is fast and darker layers forming in the winter when growth slows. Coral colonies can live for decades to centuries. Compiled coral data can span several hundred years. Sometimes coral growth varies in ways that we can detect on a seasonal basis, so the resolution of the climate records gleaned from corals is annual to seasonal.
The chemical composition of the layers provides scientists with clues about past climates, while the layered structure allows them to precisely date the changes they find. Analysis of ratios of different types of oxygen isotopes in the calcium carbonate in corals tells us about sea temperatures, although variations in salinity can make these records more difficult to interpret. Since coral are only prevalent in low-latitude oceans, their climate data compliments data from intermediate and high latitude regions such as tree rings and ice cores (see map).
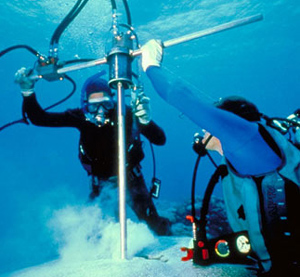
To gather coral reef proxy data from living corals, scientists don SCUBA gear and dive down to drill core samples from the reefs. Although the annual banding patterns in the coral samples are sometimes evident from visual inspection alone, in many cases X-ray imaging is required to clearly distinguish the bands. After scientists mark the annual layers in the X-ray images, they can extract samples from various layers for chemical and isotopic analysis.
Corals have a rather narrow range of environmental conditions that they can tolerate. They thrive only in warm (but not too warm!) tropical or subtropical oceans, in clear, shallow water. Most corals have a symbiotic relationship with a type of alga. The alga requires sunlight for photosynthesis, so corals that live with this alga are restricted to the ocean's photic zone (where sunlight penetrates). Sensitivity to environmental factors makes coral a good gage of local climate conditions. Modern and fossil corals are used to indicate other aspects of climate such as changes in sea level, turbidity (cloudy or muddy water), and El Niño cycles of ocean temperature variation.
Packrat MiddensPackrats, as their name implies, constantly collect all kinds of materials from their surroundings. Their collections, called "middens", provide clues to the past climates of the region. Packrat middens are clumps of vegetation, insects, remains of vertebrates, and other materials cemented together by crystallized packrat urine (referred to as amberat). These rock-hard deposits can be more than 20,000 years old.
|
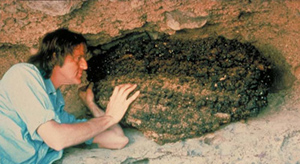
Several species of packrats live in the arid deserts of western North America. Before scientists began examining middens, little was known about the past climates of desert regions of North America, for other paleoclimate proxies such as tree rings, fossil pollen, ice and coral cores, and lake and ocean sediments are either absent from these regions or are too sparse to provide adequate data. The peculiar middens turned out to be gold mines of data for climate researchers!
Materials encased in middens are often remarkably well-preserved. Scientists are often able to sequence DNA from vegetation in middens, providing them with extraordinarily detailed insights to the evolution of plant communities, which in turn are good indicators of climatic conditions. Other astonishing artifacts have been discovered in middens. A midden from Utah contained a bone from a camel that, though once widespread in North America, had gone extinct more than 12,000 years ago.
Packrats are not the only animals that produce middens. These peculiar structures are also created by four families of rodents in South America (including a close relative of the Chinchilla), a stick-nest rat in Australia, a hyrax (a distant relative of elephants) in Africa and the Middle East, and a rock-dwelling vole in central Asia. Middens from these creatures are helping scientists reconstruct the former extent of vegetation in arid regions around the globe, and to infer the corresponding climate histories of those regions.
Speleothems
|
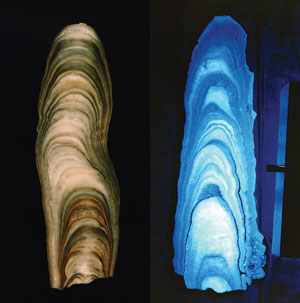
Limestone deposits in caves form stalactites, stalagmites, and flowstones. As a group, these features are called "speleothems". Speleothems form when calcite (CaCO3) is released from water droplets that have percolated through rock into a cave. Speleothems form growth rings similar to those found in trees. The rate of growth of these features depends on the rate at which rainwater enters the cave, the mineral content and acidity of the water, and the temperature and humidity within the cave. The chemical composition of the growth rings is studied to better understand the chemical composition of the rainwater (the amount of18O for example) to better understand the temperature and rainfall rate at the time of formation.
At times, caves can dry out and the formation of growth rings in speleothems will cease. Individual speleothems may have resolutions between 10 years to more than a century. However, by combining records from individual growths, these structures can yield resolutions of about 5 years. Most speleothems provide records that span a time period from the present day back to about 25 thousand years ago, though some continuous records go back as far as 160 thousand years ago.