
The Water Cycle - A Climate Change Perspective 
Climate change produces many changes in the water (hydrologic) cycle. Let's start by reviewing the water cycle, with an eye towards aspects that are likely to play a role in climate change or to be affected by changes to Earth's climate.
The diagram below summarizes, in a qualitative way, the water cycle. Reservoirs are places where water is "stored", or where it stays for some period of time. The oceans, glaciers and ice caps, lakes, and the atmosphere are some examples of reservoirs. Note that "water", in this context, means the chemical substance H2O, whether in liquid, solid, or gaseous form. Water in oceans and lakes is, of course liquid; but it is solid ice in glaciers, and gaseous water vapor in the atmosphere. Flows or pathways are the routes water takes between reservoirs. Evaporation moves water from the oceans to the atmosphere. Precipitation moves liquid (rain) or solid (snow) water from the sky back to Earth's surface. Snowmelt runoff turns solid water into a liquid that flows down rivers to the sea.
This diagram illustrates the water cycle (or hydrologic cycle). |

Three basic concepts help us add quantitative aspects to our understanding of the water cycle. We can specify the quantity of water in a specific reservoir. The oceans are by far the largest reservoir, containing between 1.35 and 1.4 x 10⁹ km3 of water; more than 95% of the total amount in the terrestrial water cycle. A second quantity we can specify is the rate of a given flow, commonly expressed in terms of cubic kilometers per year. For example, total global precipitation is about 505,000 km3 per year. Finally, a third informative quantity is the average residence time that a water molecule spends in a given reservoir. Water that evaporates into the atmosphere quickly falls back out as precipitation; the average atmospheric residence time is just nine days. By contrast, once water reaches the ocean, it can stay there for a very long time; the average residence time for water in the oceans is more than 3,000 years! It is important to realize that reported residence times are averages, and that the actual residence time for a given water molecule may be far from the average. Water vapor that reaches the stratosphere may remain there for a long time; water that flows into warm, shallow coastal waters from a river may evaporate and leave the ocean very quickly.
Which reservoirs and flows are most likely to be key players in the climate change story? Which quantities, in terms of reservoir sizes, flow rates, and residence times, are most important to have in mind when considering climate change issues? Let's take a look!
First, a couple of overview values and comments. Some of the values we present here are ranges. This is partly because there is some uncertainty in the scientific community about the exact values for some quantities; and partly because different data sources group various reservoirs and flows slightly differently. One group may consider snow as a component of the "surface water" reservoir, while another puts it into the "snow and ice" grouping. Some sources report a combined "evapotranspiration" (evaporation plus transpiration from plants) value, while others separately report ocean evaporation, land evaporation, and transpiration. You may, therefore, see numbers slightly different than the ones listed here if you consult other data sources. In any case, some of the key "big picture" values include:
- The overall water cycle "contains" between 1,386,000,000 and 1,460,000,000 km3 of water in various states (liquid, solid, or gaseous).
- The vast majority of it, between 96.5 and 97.25%, is in the oceans.
- Only about 3% of Earth's water is fresh water. About 2/3rds of that is frozen in the ice sheets near the poles and in glaciers. Most of the rest of the fresh water is underground; less than 1% of fresh water is on the surface in lakes, wetlands, and rivers.
- About 90% of the polar ice sheet and glacial ice is in Antarctica; most of the rest is in Greenland; a tiny fraction is locked up in mountain glaciers elsewhere.
- 434,000 cubic km of water evaporates from the oceans each year, while 71,000 km3 (about 1/6th as much) rises into the air over land via evaporation and transpiration.
- About 80% of rainfall is over (and into!) oceans. However, more water evaporates from the oceans than falls upon them as rain. Conversely, precipitation onto land exceeds evapotranspiration from land. Runoff that flows in rivers to the seas makes up for most of this imbalance.
Now, on to climate change! We'll survey a few climate change issues and pull in the quantitative values for reservoirs, flows, and residence times most germane to each of those issues.
Melting Ice
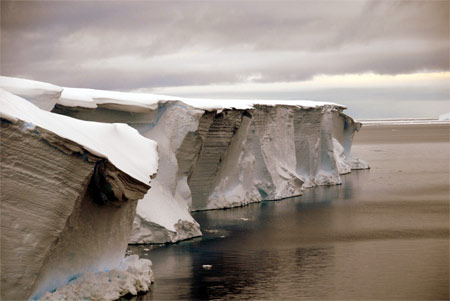 Increased average global temperatures have begun to accelerate melting of some glaciers, sea ice, snow, and ice sheets. Such melting can produce positive feedback loops; darker areas (especially oceans, but also land features) beneath the high-albedo snow or ice absorb more light than the bright snow or ice had done, and thus warm still further, melting more snow and ice.
Extensive melting of ice can produce more freshwater runoff into oceans, altering the salinity of sea water. Differences in density, caused by variations in temperature and salinity, drive major ocean currents and circulation patterns. Changes to these currents can alter global heat transport patterns driven by the currents, stimulating further climate change.
Here are some numbers concerning reservoirs, flows, and residence times relevant to melting snow and ice processes:
- About 90% of the polar ice sheet and glacial ice is in Antarctica; most of the rest is in Greenland; a tiny fraction is locked up in mountain glaciers elsewhere.
- Although ice and snow contain only about 2% of Earth's water (compared to about 97% in the oceans), complete melting of the glaciers and ice sheets would raise sea levels worldwide almost 70 meters (230 feet) above current levels. Complete melting of the Greenland ice sheet would contribute 7.2 meters of sea level rise, while complete melting of the Antarctic ice sheet would produce 61.1 meters of sea level rise. Melting glaciers would add another half of a meter.
- The Antarctic ice sheet has been in existence for at least 40 million years. However, the oldest ice so far detected at a single ice core drilling site in Antarctica is about 900,000 years old. In Greenland, the oldest ice so far detected dates back 123,000 years. In any case, water can clearly spend thousands, tens of thousands, or even hundreds of thousands of years in a frozen state in an ice sheet before returning to other parts of the water cycle.
- Water in glaciers remains there for shorter periods; residence times of 20 to 100 years are more typical.
- Each year about 11,000 km3 of water falls out of the atmosphere as snow; and each year, about 11,000 km3 of snow and ice melt back into water. Typically, the residence time of water as seasonal snow is around 2 to 6 months.
- Annually, about 8 mm (0.3 inches) of water from the entire surface of the oceans goes into the Antarctica and Greenland ice sheets as snowfall. Each year, this amount also melts, returning water to the seas.
- In many places, glaciers on Greenland reach to the sea, and one estimate is that as much as 517 km3 (125 mi3) of ice "calves" into the ocean each year.
- All told, somewhere between 24 and 44 million km3 of water is in the form of snow and ice at any given time.
Evaporation and Precipitation Rates
Rising global temperatures are likely to accelerate evaporation rates worldwide. Water tends to cycle through the atmosphere very quickly; the atmosphere has the shortest residence time of any major component of the water cycle. So more evaporation is likely to lead to more rainfall, in a globally averaged sense. Many scientists speak of a "spun up" water cycle as a result of global warming; more water cycling through the atmosphere as a result of the increased precipitation rate.
Some 96,000 km3 of rain falls upon land somewhere in the world each year. The picture on the left shows a "rain shaft" below a cumulonimbus cloud. Sometimes precipitation and evaporation combine; when raindrops fall through hot, dry air, they sometimes evaporate before reaching the ground. Such evaporating rain is called "virga". Much of the rain in the photo on the right is virga. |


There is no guarantee, however, that these increased evaporation and precipitation rates will be distributed evenly worldwide. Some areas may experience floods, other droughts, as the tradition locations of rain belts and deserts shift in response to a changing climate. Some climate models predict wetter coastal regions and drier interiors for continental land masses. Also, some models forecast more evaporation and rainfall over oceans, but not necessarily over land.
Warmer temperatures and increased carbon dioxide levels may encourage plant growth in many regions. Increased transpiration, the release of water into the air by plants as a result of photosynthesis, would be likely in such a scenario. Uptake of water from the soils by plants would also need to increase if there were more plants, or if plants began to grow more rapidly.
Here are some values related to evaporation and precipitation rates:
- 434,000 cubic km of water evaporates from the oceans each year, while 71,000 km3 (about 1/6th as much) rises into the air over land via evaporation and transpiration.
- About 80% of rainfall is over (and into!) oceans. However, more water evaporates from the oceans than falls upon them as rain. Conversely, precipitation onto land exceeds evapotranspiration from land. Runoff that flows in rivers to the seas makes up for most of this imbalance. About 398,000 km3 of precipitation falls upon the oceans each year, while 107,000 km3 (96,000 km3 of rain and 11,000 km3 of snow) falls upon land.
- The residence time for water in the atmosphere is a brief nine days; the shortest of any major reservoir.
- Residence times for moisture in the soil average around one to two months. Roughly 122,000 km3 of water is contained in soil reservoirs. Transpiration puts 21,000 km3 of water into the air (essentially the same amount as is absorbed from the soil by plants), while evaporation from land accounts for 50,000 km3 of water in the atmosphere.
|
The Deep Blue Sea
Oceans play a critical role in both the water cycle and in climate change issues. Oceans are vast, and so are their influences. Heat, dissolved chemicals (including carbon dioxide), and vast quantities of water can be stored in the oceans for very long times. The flows of water to and from the oceans overwhelm other flows, so slight changes in them can have powerful effects. A shift of a small fraction of the oceans waters to another reservoir can dramatically alter that reservoir's size.
Although we've mentioned several of these quantities before, they bear repeating, for their influences are so dominant.
- About 97% of Earth's water (between 1,338,000,000 and 1,400,000,000 km3) is in the oceans.
- 80% of annual global precipitation, 398,000 km3, falls into the oceans.
- Roughly 5/6ths (434,000 cubic km) of all evaporation wafts into the air from the oceans.
- Average residence times for water molecules in the oceans are around 3,200 years!
- The oceans are actually divided into two major regions, plus a third "middle ground". These divisions are discussed further in the "Transfer and Storage of Heat in the Oceans" reading. The surface layer holds some 50 million km3 of water; the middle "thermocline" region contains about 460 million km3; and the deep ocean reservoir has the remaining 890 million km3.
Water Cycle Tables: Reservoirs, Flows, and Residence Times
We've tossed lots of numbers your way on this page; here's an attempt to summarize them into a few concise tables. Please realize that these values have been rounded up from various sources that don't all report the same numbers; so some totals may not quite be the sum of their constituents. I some cases, we've provided ranges for values that various sources disagree on. We've also tried to give a sense of relevant percentages where appropriate (e.g. "3% of Earth's water is fresh water", "90% of ice mass is in Antarctica").
Reservoir Sizes & Fractions/Percentages
| Reservoir | Volume |
Fraction or % of a larger reservoir |
| All of Earth's water | 1,386,000,000 to 1,460,000,000 km3 | NA |
| Oceans | 1,338,000,000 to 1,400,000,000 km3 | 97% of total water |
| Fresh water | 35,030,000 km3 |
2.5 to 3% of total water |
| Ice & snow | 43,400,000 km3 |
- |
| Ice caps, glaciers, and permanent snow | 24,064,000 to 29,000,000 km3 |
68.7% of fresh water ~2% of total water |
| Antarctic ice & snow | 29,000,000 km3 |
~90% of all ice |
| Greenland | 3,000,000 km3 |
~10% of all ice |
| Glaciers (not Greenland or Antarctica) | 100,000 km3 |
- |
| Ground water (saline and fresh) | 23,400,000 km3 |
- |
Ground water (saline) |
- |
54% of ground water |
| Ground water (fresh) | 10,530,000 km3 |
30.1% of fresh water 46% of ground water |
| Surface water (fresh) | - |
0.3% of fresh water |
| Lakes | - |
87% of surface fresh water |
| Swamps | - |
11% of surface fresh water |
| Rivers | - |
2% of surface fresh water |
| Atmosphere | 12,000 to 15,000 km3 |
- |
Flows (between reservoirs)
| Process | From/to Reservoir | Flow Rate |
| Precipitation | Atmosphere to Ocean/Land | 505,000 km3/year |
| Ocean precipitation |
Atmosphere to Ocean | 398,000 km3/year |
| Land precipitation (except snow?) |
Atmosphere to Land/surface | 96,000 to 107,000 km3/year |
| Evapotranspiration | Ocean and Land/surface and Plants to Atmosphere | 505,000 km3/year |
| Ocean evaporation |
Ocean to Atmosphere | 434,000 km3/year |
| Land evaporation |
Land/surface to Atmosphere | 50,000 km3/year |
| Transpiration |
Plants to Atmosphere | 21,000 km3/year |
| Uptake by plants |
Land/surface to Biota | 21,000 km3/year |
| Runoff |
Land/surface to Ocean | 36,000 km3/year |
| Melting |
Ice/snow to Land/surface | 11,000 km3/year |
| Snowfall (on land only?) |
Atmosphere to Ice/Snow | 11,000 km3/year |
| Percolation |
Underground to and from (??) Land/surface | 100 km3/year |
Residence Times (in reservoirs)
| Reservoir | Residence Time (average) |
| Oceans | 3,000 to 3,230 years |
| Glaciers | 20 to 100 years |
| Seasonal Snow Cover | 2 to 6 months |
| Soil Moisture | 1 to 2 months |
| Groundwater: Shallow | 100 to 200 years |
| Groundwater: Deep | 10,000 years |
Lakes |
50 to 100 years |
| Rivers | 2 to 6 months |
| Atmosphere | 9 days |