Current Events

  • Irish Chronicles Document Links Between Volcanoes and Weather
    A study of over 40,000 written entries in Irish Annals and ice core measurements shows a strong corr...Read more

    x

    Irish Chronicles Document Links Between Volcanoes and Weather

    A study of over 40,000 written entries in Irish Annals and ice core measurements shows a strong correlation between the occurrence of volcanic eruptions and extreme cold weather in Ireland over a 1200 year period. Data analyzed in this study cover the period from 431 to 1649, during which time up to 48 volcanic eruptions are identified in Greenland ice core records through deposition of volcanic sulfate in annual layers of ice. You can find the study (open access), published on 6 June 2013 in IOP Publishing's journal Environmental Research Letters, at http://iopscience.iop.org/1748-9326/8/2/024035/article. Find out more about how volcanoes can influence climate.
  • EF-5 Tornado in El Reno, Oklahoma Widest Ever Recorded in US
    The EF-5 tornado that hit El Reno, Oklahoma on May 31st was the widest ever recorded in the US, acco...Read more

    x

    EF-5 Tornado in El Reno, Oklahoma Widest Ever Recorded in US

    The EF-5 tornado that hit El Reno, Oklahoma on May 31st was the widest ever recorded in the US, according to the National Weather Service in Norman Oklahoma. The tornado, which remained on the ground for 40 minutes and reached 2.6 miles across (4.2 km), took the lives of 18 people including storm chasers Tim Samaras, Paul Samaras and Carl Young. For more information on the tornado, visit http://ow.ly/i/2hfDG.
  • Atmospheric CO2 Level Tops 400 ppm
    During the week of May 13th, the CO2 level at the Mauna Loa Observatory in Hawaii topped 400 ppm rep...Read more

    x

    Atmospheric CO2 Level Tops 400 ppm

    During the week of May 13th, the CO2 level at the Mauna Loa Observatory in Hawaii topped 400 ppm repeatedly. Daily levels of CO2 can vary due to weather, and there are seasonal trends as well. The level of atmospheric greenhouse gases continues to increase, now over 120 ppm since the Industrial Revolution began. For more on the Keeling Curve, see http://keelingcurve.ucsd.edu/. Find out more about greenhouse gases and warming.
The amount of precipitation changes during El Niño in many areas of the world. The map above shows precipitation anomalies during El Niño for Northern Hemisphere winter.
Click on image for full size
Courtesy of NOAA

Teleconnections: Changes in Weather Linked Together

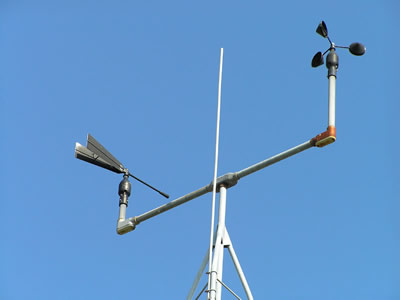
Changes in the atmosphere in one place can affect weather over 1000 miles away. Scientists are trying to sort out how this works so that they can better understand and predict weather patterns worldwide. They call these patterns teleconnections.

Teleconnection patterns are caused by changes in the way air moves around the atmosphere. The changes may last from a few weeks to many months. Teleconnection patterns are natural. However, they may be changed as Earth’s climate warms.

There are a number of different teleconnection patterns. Here are two examples:

El Niño
El Niño is a major teleconnection pattern created by El Niño-Southern Oscillation (ENSO) changes to the atmosphere and ocean. During El Niño events cold and dry air is blown into places that typically have warm and moist air. This causes a big change in the weather. For example, the amount of clouds in one area could lead to changes in precipitation elsewhere. Changes in the temperature of the ocean surface in the tropical Pacific Ocean also affect the weather.

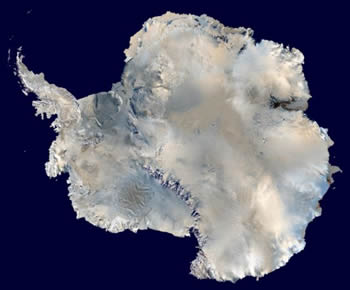
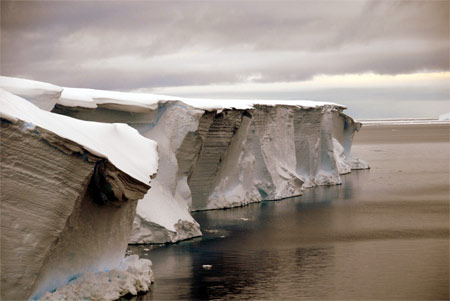
Other areas are affected by El Niño, too. Southern Alaska, for example, can become warmer than usual. And the U.S. Gulf Coast can be cooler and more rainy than usual. El Niño even has an impact as far away as West Antarctica. There is evidence from ice cores that during the strong El Niño event from 1939-1942 temperatures in West Antarctica were 5-7 C (9-13 F) warmer than normal.

The North Atlantic Oscillation
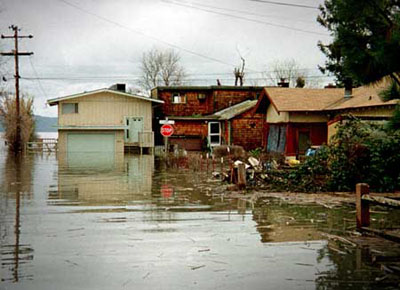
A teleconnection pattern with roots in the Atlantic causes unusual weather in the Northern Hemisphere. The cause is the North Atlantic Oscillation (NAO) - changes in the intensity of a low pressure system over Iceland and a high pressure system in the subtropical Atlantic. During the winter of 1995-96 the changes in pressure caused cold and snowy weather in eastern North America, bitter cold in Northern Europe, and wet weather in southern Europe and northern Africa.

Last modified September 18, 2008 by Lisa Gardiner.

Shop Windows to the Universe Science Store!

The Fall 2009 issue of The Earth Scientist, which includes articles on student research into building design for earthquakes and a classroom lab on the composition of the Earth’s ancient atmosphere, is available in our online store.

Windows to the Universe Community

News

Opportunities

You might also be interested in:

Traveling Nitrogen Classroom Activity Kit

Check out our online store - minerals, fossils, books, activities, jewelry, and household items!...more

Antarctica

Antarctica is unique. It is the coldest, windiest, and driest continent on Earth. The land is barren and mostly covered with a thick sheet of ice. Antarctica is almost entirely south of the Antarctic Circle...more

El Niño and Other Climate Events

Sometimes there is a change in the way air moves through parts of the atmosphere. And there are sometimes changes in the way water moves through the ocean too. This disturbs typical weather patterns, or...more

Rainbows

Rainbows appear in the sky when there is bright sunlight and rain. Sunlight is known as visible or white light and is actually a mixture of colors. Rainbows result from the refraction and reflection of...more

The Four Seasons

The Earth travels around the sun one full time per year. During this year, the seasons change depending on the amount of sunlight reaching the surface and the Earth's tilt as it revolves around the sun....more

Research Aircraft

Scientists sometimes travel in specially outfitted airplanes in order to gather data about atmospheric conditions. These research aircraft have special inlet ports that bring air from the outside into...more

Anemometer

An anemometer is a weather instrument used to measure the wind (it can also be called a wind gauge). Anemometers can measure wind speed, wind direction, and other information like the largest gust of wind...more

Thermometer

Thermometers measure temperature. "Thermo" means heat and "meter" means to measure. You can use a thermometer to measure the temperature of many things, including the temperature of...more

Shop Windows to the Universe

The Spring 2011 issue of The Earth Scientist is focused on modernizing seismology education. Thanks to IRIS, you can download this issue for free as a pdf. Print copies are available in our online store.

Windows to the Universe, a project of the National Earth Science Teachers Association, is sponsored in part by the National Science Foundation and NASA, our Founding Partners (the American Geophysical Union and American Geosciences Institute) as well as through Institutional, Contributing, and Affiliate Partners, individual memberships and generous donors. Thank you for your support! NASA AGU AGI NSF