Air moves into a Low pressure system. It pushes any air that was there upwards.
Click on image for full size
Windows to the Universe original image
Low Pressure Systems
You may have seen a
weather map with a red L on it. This red L means there is a low pressure system over that area of the map. Just what does that mean?
There are no exact measurements that would make a system a Low. It's all relative! If a certain system is a Low pressure system, that means it has lower pressure than the areas around it.
The differences in pressure from one place to another on Earth are what cause wind. You see, air wants to move from areas of high pressure to areas of low pressure. Away from areas of high pressure and into areas of low pressure...
The Coriolis Force also adds rotation to the movement of air. In the Northern Hemisphere, air moves clockwise around a High and counter-clockwise around a Low.
Air moves into a Low pressure system. It pushes any air that was there up. As the air rises, water vapor condenses into clouds that can bring precipitation. That's why many people see a red L on weather chart and know there is a good chance of "bad" weather - cloudy skies and possibilities of rain or snow.
You might also be interested in:
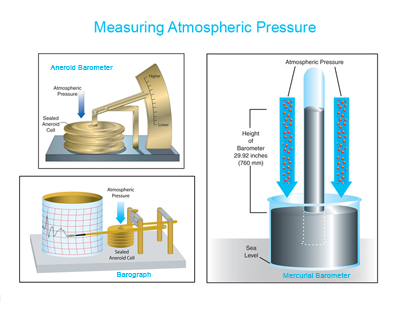
Even though we can't see air, it is real and has pressure. The pressure of the atmosphere changes. It is higher at sea level, and lessens as you go higher up in the atmosphere. Some weather systems have
...more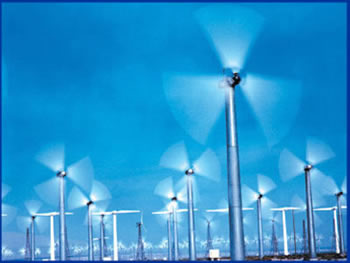
Wind is moving air. Warm air rises, and cool air comes in to take its place. This movement creates different pressures in the atmosphere which creates the winds around the globe. Since the Earth spins,
...more
How many hurricanes will form this year? How strong will they be? While no one can say for sure, teams of scientists make predictions each year about the strength of the upcoming hurricane season. To make
...more
Below is a list of some weather conditions that call for an advisory, watch, or warning. Severe Thunderstorm Watch: A severe thunderstorm watch is issued when a thunderstorm with winds greater than 57
...more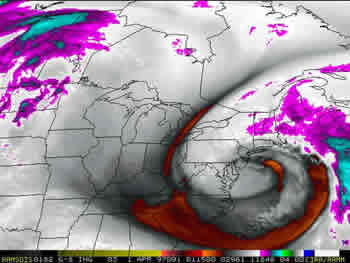
Northeasters, also known as noreasters, are cyclonic, cold winds that develop in the mid-latitudes. They can bring heavy snow or sleet and gale force winds of 40-55 mph (64.5-88.7 kph). This type of wind
...more
Measuring sea level, the height of the ocean surface, allows scientists to calculate whether sea level is changing over time and how much sea level rise is happening now because of global warming. But
...more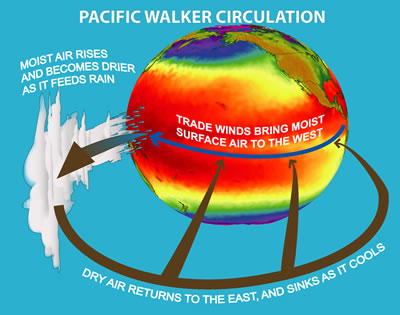
The Walker circulation is an ocean-based system of air circulation that influences weather on the Earth. The Walker circulation is the result of a difference in surface pressure and temperature over the
...more